History for
SFTEST - 2008
(history as of 8/7/2014 2:54:57 PM)
SFTEST
Updated: 27 June 2012
Use the aggregate function SFTEST to perform the Shapiro-Francia test for the composite hypothesis of normality. The test statistic of the Shapiro-Francia test is simply the squared correlation between the ordered sample values and the (approximated) expected ordered quantiles from the standard normal distribution. The p-value is computed from the formula given by Royston (1993).
Syntax
Arguments
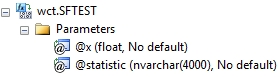
@x
the sample values. @x is an expression of type float or of a type that can be implicitly converted to float.
@statistic
identifies the return value as either the Shapiro-Francia statistic (w) or the p-value (p).
Return Types
float
Remarks
· If @x is null then @x is not included in the aggregate.
· @statistic must be invariant for the GROUP.
· SFTEST is an aggregate function and follows the same conventions as all other aggregate functions in SQL Server.
· @x must have at least 3 rows
Examples
In this example, we have two samples, which we have identified as sample 1 and sample 2 and we perform the Shapiro Francia test on both in a single SELECT, grouping the results by sample number.
SELECT n.s as sample_num
,wct.SFTEST(x,'w') as w_observed
,wct.SFTEST(x,'p') as p_value
FROM (VALUES
(1,0.11),(2,3.49),
(1,7.87),(2,1.36),
(1,4.61),(2,1.14),
(1,10.14),(2,2.92),
(1,7.95),(2,2.55),
(1,3.14),(2,1.46),
(1,0.46),(2,1.06),
(1,4.43),(2,5.27),
(1,0.21),(2,-1.11),
(1,4.75),(2,3.48),
(1,0.71),(2,1.10),
(1,1.52),(2,0.88),
(1,3.24),(2,-0.51),
(1,0.93),(2,1.46),
(1,0.42),(2,0.52),
(1,4.97),(2,6.20),
(1,9.53),(2,1.69),
(1,4.55),(2,0.08),
(1,0.47),(2,3.67),
(1,6.66),(2,2.81)
) n(s,x)
GROUP BY n.s
This produces the following result
sample_num w_observed p_value
----------- ---------------------- ----------------------
1 0.917024201827551 0.0810926381951407
2 0.956959220606241 0.411915065401292
|<< Back |