ROCTable
Updated: 08 May 2015
Use the table-valued function ROCTable to show the calculation of the area under the ROC curve. The function accepts either raw or grouped data as input.
The function has a single input parameter which is an SQL SELECT statement which, when executed, returns a resultant table where the first column is the predicted probabilities. For the raw case, the SQL will return one additional column, consisting of zeroes and ones indicating the absence (0) or presence (1) of the characteristic of interest. You may also think of these as indicating the failure (0) or success (1) of the observation.
For the grouped case, the input SQL will return two additional columns containing the count of failures and successes for a predicted probability.
The function returns a table (described below) sorted by ascending predicted probability which calculates the True Positive Rate, the False Positive Rate, and the area under the ROC curve (AUROC). This is the same value returned by the LOGIT and LOGITSUM functions.
Syntax
SELECT * FROM [wct].[ROCTable](
<@Matrix_RangeQuery, nvarchar(max),>)
@Matrix_RangeQuery
the SELECT statement, as a string, which, when executed, creates the resultant table of predicted probabilities and Y values.
Return Types
RETURNS TABLE (
[idx] [int] NULL,
[ppred] [float] NULL,
[failure] [int] NULL,
[success] [int] NULL,
[cumfailure] [int] NULL,
[cumsuccess] [int] NULL,
[FalsePositiveRate] [float] NULL,
[TruePositiveRate] [float] NULL,
[AUROC] [float] NULL,
[cumAUROC] [float] NULL
)
Table Description
|
Column
|
Description
|
|
idx
|
a unique identifier for the row identifying its positon in the resultant table
|
|
ppred
|
predicted probability
|
|
failure
|
for raw data, the count of the number of rows for the predicted probability having a value of 0. For grouped data, the sum of the second column passed into the function grouped by predicted probability
|
|
success
|
for raw data, the sum of the second column grouped by predicted probability. For grouped data, the sum of the third column passed into the function grouped by the predicted probability
|
|
cumfailure
|
the sum of failure for the current row and all preceding rows
|
|
cumsuccess
|
the sum of success for the current row and all preceding rows
|
|
FalsePositiveRate
|
cumfailure(idx) /cumfailure(idxmax)
|
|
TruePositiveRate
|
cumsuccess(idx) /cumsuccess(idxmax)
|
|
AUROC
|
[FalsePositiveRate(idx+1) – FalsePositiveRate(idx)] * TruePositiveRate(idx)
|
|
cumAUROC
|
the sum of AUROC for the current row and all preceding rows
|
Remarks
· The first column returned by @Matrix_RangeQuery should contain the predicted probabilities where 0 <= predicted probability <= 1.
· The resultant table returned by @Matrix_RangeQuery should return either 2 columns or 3 columns.
· When the resultant table contains 2 columns the function assumes that the second column contains binary responses consisting of zero (0) or (1); the use of other values will produce unreliable results.
· When the resultant table contains 3 columns the function assumes that the second column contains a count of the failures or absences and the third column contains a count of the successes or presence.
Examples
Example #1
In this example we use the same data as was used in the LOGIT documentation, consisting of the Coronary Heart Disease data from Applied Logistic Regression, Third Edition by David W. Hosmer, Jr., Stanley Lemeshow, and Rodney X. Sturdivant. The data consist of a single independent variable (age) and an outcome (chd) which indicates the absence (0) or presence (1) of coronary heart disease. We will put the data into a temporary table, run the logistic regression, use the coefficients from the logistic to create the predicted probabilities and then produce the ROC table. Note that the AUROC value is actually returned by the LOGIT function; this example simply explains the calculation.
--Put the Hosmer data into the #chd table
SELECT
*
INTO
#chd
FROM (VALUES
(20,0),(23,0),(24,0),(25,0),(25,1),(26,0),(26,0),(28,0),(28,0),(29,0)
,(30,0),(30,0),(30,0),(30,0),(30,0),(30,1),(32,0),(32,0),(33,0),(33,0)
,(34,0),(34,0),(34,1),(34,0),(34,0),(35,0),(35,0),(36,0),(36,1),(36,0)
,(37,0),(37,1),(37,0),(38,0),(38,0),(39,0),(39,1),(40,0),(40,1),(41,0)
,(41,0),(42,0),(42,0),(42,0),(42,1),(43,0),(43,0),(43,1),(44,0),(44,0)
,(44,1),(44,1),(45,0),(45,1),(46,0),(46,1),(47,0),(47,0),(47,1),(48,0)
,(48,1),(48,1),(49,0),(49,0),(49,1),(50,0),(50,1),(51,0),(52,0),(52,1)
,(53,1),(53,1),(54,1),(55,0),(55,1),(55,1),(56,1),(56,1),(56,1),(57,0)
,(57,0),(57,1),(57,1),(57,1),(57,1),(58,0),(58,1),(58,1),(59,1),(59,1)
,(60,0),(60,1),(61,1),(62,1),(62,1),(63,1),(64,0),(64,1),(65,1),(69,1)
)n(age,chd)
--Run LOGIT and store the results in #mylogit
SELECT
*
INTO
#mylogit
FROM
wct.LOGIT('SELECT age,chd FROM #chd',2)
--Calculate the predicted probabilities for each row in #chd and store the
--predicted probability and the chd value in #t
SELECT
wct.LOGITPRED('SELECT stat_val FROM #mylogit where stat_name = ''b'' ORDER BY idx',cast(age as varchar(max))) as [p predicted]
,chd as y
INTO
#t
FROM
#chd
--Run the ROCTable function
SELECT
*
FROM
wct.ROCTable('SELECT * FROM #t')
This produces the following result.
You can see from the table that the cumulative AUROC value is 0.789881680946553. This is the same as the value returned by LOGIT.
--Get the AUROC value from #mylogit
SELECT
stat_val
FROM
#mylogit
WHERE
stat_name = 'AUROC'
This produces the following result.
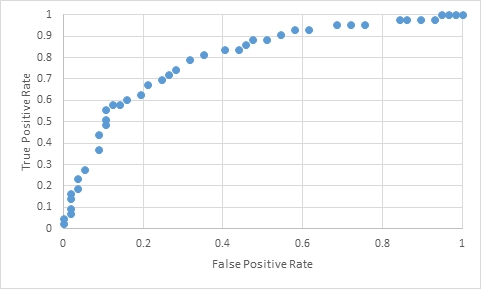
However, ROCTable does return the False Positive Rate and the True Positive Rate, which can be graphed using SSRS, Excel, or any tool that you prefer. In this example, I have simply copied the FalsePositiveRate and TruePositiveRate from ROCTable, pasted them into Excel, and then produced the following graph.
It is worth noting that our input data consisted of 100 rows, yet ROCTable only returned 43 rows of data from the temporary table #t, even though we generated a predicted probability for all 100 rows. This is because there were not 100 unique predicted probabilities. We can get the number of unique predicted probabilities using the following SQL.
SELECT COUNT(DISTINCT [p predicted]) as [COUNT p predicted] FROM #t
This produces the following result, which matches what was returned by ROCTable.
As Hosmer points out in section 5.4.2 "let n1 denote the number of subjects with y = 1 and n0 denote the number of subjects with y = 0. We can then create n1 x n0 pairs; each subject with y = 1, paired with each subject with y = 0. Of these n1 x n0 pairs, we determine the proportion of the pairs where the subject with y = 1 had the higher of the two probabilities. This proportion may be shown to be equal to the area under the ROC Curve."
The technique that he is suggesting lends itself quite well to SQL and we can use it to check the AUROC calculation in both LOGIT and ROCTable. We would not recommend this calculation as a practical matter as it requires a Cartesian product; in this case 57 x 43 combinations.
--Calculate the area under the ROC Curve using a Cartesian product
;with mycte as (
SELECT
n1.y as y1,
n1.[p predicted] as p1,
n0.y as y0,
n0.[p predicted] as p0
FROM
#t n1, #t n0
WHERE
n1.y = 1 AND n0.y = 0
)
SELECT
COUNT(m1.y1)/cast(n.pairs as float) As AUROC
,n.pairs
FROM
(SELECT SUM(y1) FROM mycte)n(pairs)
,mycte m1
WHERE
m1.p1 >= m1.p0
GROUP BY
n.pairs
This produces the following result.
Now, let's look at an example using grouped data. The data consist of 3 independent variables; x1, x2, and x3, and 2 additional columns; the number of successes for that combination of independent variables and the number of observations for that combination of independent variables.
--Put grouped data into a temporary table #x
SELECT
*
INTO
#x
FROM (VALUES
(100,1,10,28,156)
,(150,1,10,33,144)
,(200,1,10,44,171)
,(250,1,10,56,196)
,(300,1,10,55,158)
,(350,1,10,44,100)
,(400,1,10,57,126)
,(450,1,10,77,166)
,(500,1,10,84,166)
,(100,2,10,23,153)
,(150,2,10,31,165)
,(200,2,10,40,179)
,(250,2,10,42,152)
,(300,2,10,55,181)
,(350,2,10,68,200)
,(400,2,10,59,148)
,(450,2,10,69,156)
,(500,2,10,75,157)
,(100,1,11,19,164)
,(150,1,11,23,147)
,(200,1,11,35,182)
,(250,1,11,46,196)
,(300,1,11,41,143)
,(350,1,11,60,189)
,(400,1,11,59,162)
,(450,1,11,75,187)
,(500,1,11,59,129)
,(100,2,11,9,105)
,(150,2,11,22,179)
,(200,2,11,30,182)
,(250,2,11,32,155)
,(300,2,11,41,164)
,(350,2,11,58,200)
,(400,2,11,60,181)
,(450,2,11,75,199)
,(500,2,11,59,141)
)n(x1,x2,x3,success,N)
--Run LOGIT and store the results in #mylogit
SELECT
*
INTO
#mylogit
FROM
wct.LOGITSUM('SELECT x1,x2,x3,success,n-success from #x',4,5)
--Calculate the predicted probabilities using LOGITPROB for each row in #x and store the
--predicted probability and the group totals in #t
SELECT
wct.LOGITPROB(n.x, m.stat_val) as [p predicted]
,n-Success as failure
,success as success
INTO
#t
FROM
#x
CROSS APPLY(VALUES (0,1),(1,x1),(2,x2),(3,x3))n(idx,x)
INNER JOIN
#mylogit m
ON
m.idx = n.idx
WHERE
m.stat_name = 'b'
GROUP BY
n-Success, success
--Run ROCTable function
SELECT
*
FROM
wct.ROCTable('SELECT * FROM #t')
This produces the following result.
You can see from the table that the cumulative AUROC value is 0.639751323614436. This is the same as the value returned by LOGITSUM.
--Get the AUROC value from #mylogit
SELECT
stat_val
FROM
#mylogit
WHERE
stat_name = 'AUROC'
This produces the following result.
We can modify our SQL slightly from the previous example in order to verify the calculation of the area under the ROC curve using the Cartesian product.
--Calculate the area under the ROC Curve using a Cartesian product
SELECT
SUM(n.y0*n.y1)/cast(p.pairs as float) as AUROC
,p.pairs
FROM (
SELECT
t1.success as y1,
t1.[p predicted] as p1,
t2.failure as y0,
t2.[p predicted] as p0
FROM
#t t1, #t t2
)n
,(SELECT SUM(success) * SUM(failure) FROM #t)p(pairs)
WHERE
p1 >= p0
GROUP BY
p.pairs
This produces the following result.
See Also