EXPDIST
Updated: 31 July 2010
Use EXPDIST to calculate the probability density function or the upper cumulative distribution function of the Exponential distribution.
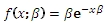
The formula for the probability density function is:
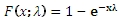
The upper cumulative distribution function is:
Syntax
SELECT [wctStatistics].[wct].[EXPDIST] (
<@X, float,>
,<@Lambda, float,>
,<@Cumulative, bit,>)
Arguments
@X
is the value to be evaluated. @X is an expression of type float or of a type that implicitly converts to float.
@Lambda
is the rate parameter. @Lambda is an expression of type float or of a type that implicitly converts to float.
@Cumulative
is a logical value that determines if the probability density function ('False', 0) or the cumulative distribution function ('True', 1) is being calculated. @Cumulative is an expression of type bit or of a type that implicitly converts to bit.
Return Types
float
Remarks
· @X must be greater than or equal to zero (@X ≥ 0).
· @Lambda must be greater than zero (@lambda > 0).
· The lower cumulative distribution function is equal to 1 –EXPDIST(@X,@A, 'True').
Examples
Calculate the probability density function:
SELECT wct.EXPDIST(.75,9.5,'False')
This produces the following result
----------------------
0.00764496359618383
(1 row(s) affected)
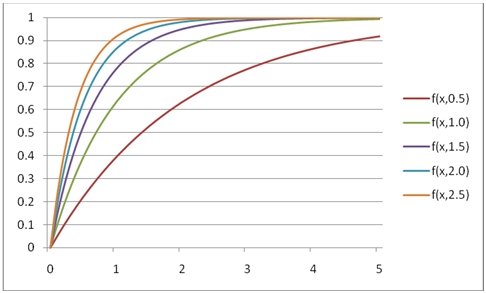
You can use the SeriesFloat function from the XLeratorDB/math library to generate a dataset which can be pasted into EXCEL to generate a graph of the probability density function.
SELECT SeriesValue
,wct.EXPDIST(SeriesValue, 0.5, 'False') as [f(x,0.5)]
,wct.EXPDIST(SeriesValue, 1.0, 'False') as [f(x,1.0)]
,wct.EXPDIST(SeriesValue, 1.5, 'False') as [f(x,1.5)]
,wct.EXPDIST(SeriesValue, 2.0, 'False') as [f(x,2.0)]
,wct.EXPDIST(SeriesValue, 2.5, 'False') as [f(x,2.5)]
FROM wct.SeriesFloat(0, 5, .1,NULL,NULL)
This is an EXCEL-generated graph of the results
Calculate the upper cumulative distribution function:
SELECT wct.EXPDIST(.75,9.5,'True')
This produces the following result
----------------------
0.999195266989875
(1 row(s) affected)
You can use the SeriesFloat function from the XLeratorDB/math library to generate a dataset which can be pasted into EXCEL to generate a graph of the cumulative distribution function.
SELECT SeriesValue
,wct.EXPDIST(SeriesValue, 0.5, 'True') as [f(x,0.5)]
,wct.EXPDIST(SeriesValue, 1.0, 'True') as [f(x,1.0)]
,wct.EXPDIST(SeriesValue, 1.5, 'True') as [f(x,1.5)]
,wct.EXPDIST(SeriesValue, 2.0, 'True') as [f(x,2.0)]
,wct.EXPDIST(SeriesValue, 2.5, 'True') as [f(x,2.5)]
FROM wctMath.wct.SeriesFloat(0, 5, .1,NULL,NULL)
This is an EXCEL-generated graph of the results
Calculate the lower cumulative distribution function:
SELECT 1 - wct.EXPDIST(.75,9.5,'True')
This produces the following result
----------------------
0.000804733010124625
(1 row(s) affected)