COVARIANCE_P
Updated: 24 May 2013
Note: This documentation is for the SQL2008 (and later) version of this XLeratorDB function, it is not compatible with SQL Server 2005.
Click here for the SQL2005 version of the COVARIANCE_P function
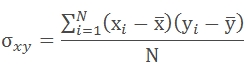
Use the aggregate function COVARIANCE_P to calculate the population covariance for a set of x- and y-values. The formula for the population covariance is
Syntax

@Known_y
the y-values to be used in the calculation. @Known_y is an expression of type float or of a type that can be implicitly converted to float.
@Known_x
the x-values to be used in the calculation. @Known_x is an expression of type float or of a type that can be implicitly converted to float.
Return Types
float
Remarks
· COVARIANCE_P is an AGGREGATE function and follows the same conventions as all other AGGREGATE functions in SQL Server.
Examples
In this example, we calculate the population covariance for a single set of x- and y-values
SELECT wct.COVARIANCE_P(y, x) as COVARIANCE_P
FROM (
SELECT 0.75, 1 UNION ALL
SELECT 2.5, 2 UNION ALL
SELECT 6.75, 3 UNION ALL
SELECT 10, 4
) n(x,y)
This produces the following result
COVARIANCE_P
----------------------
4
In this example, we will populate some temporary table with some historical financial information and then calculate the population covariance. First, create the table and put some data in it:
CREATE TABLE #c(
SYM NVARCHAR(5),
YE BIGINT,
REV FLOAT,
GPROF FLOAT,
OPINC FLOAT,
NETINC FLOAT
)
INSERT INTO #c VALUES('YHOO',2009,6460.32,3588.57,386.69,597.99)
INSERT INTO #c VALUES('YHOO',20,72.5,4185.14,12.96,418.92)
INSERT INTO #c VALUES('YHOO',2007,6969.27,4130.52,695.41,639.16)
INSERT INTO #c VALUES('YHOO',2006,6425.68,3749.96,940.97,751.39)
INSERT INTO #c VALUES('YHOO',2005,5257.67,3161.47,1107.73,1896.23)
INSERT INTO #c VALUES('GOOG',2009,23650.56,14806.45,8312.19,6520.45)
INSERT INTO #c VALUES('GOOG',20,21795.55,13174.04,5537.21,4226.86)
INSERT INTO #c VALUES('GOOG',2007,16593.99,9944.9,54.44,4203.72)
INSERT INTO #c VALUES('GOOG',2006,10604.92,6379.89,3550,3077.45)
INSERT INTO #c VALUES('GOOG',2005,6138.56,3561.47,2017.28,1465.4)
INSERT INTO #c VALUES('MSFT',2010,62484,509,24167,18760)
INSERT INTO #c VALUES('MSFT',2009,58437,46282,21225,14569)
INSERT INTO #c VALUES('MSFT',20,60420,48822,22271,17681)
INSERT INTO #c VALUES('MSFT',2007,51122,40429,18438,14065)
INSERT INTO #c VALUES('MSFT',2006,44282,36632,16064,12599)
INSERT INTO #c VALUES('ORCL',2010,26820,21056,9062,6135)
INSERT INTO #c VALUES('ORCL',2009,23252,18458,8321,5593)
INSERT INTO #c VALUES('ORCL',20,22430,17449,7844,5521)
INSERT INTO #c VALUES('ORCL',2007,17996,13805,5974,4274)
INSERT INTO #c VALUES('ORCL',2006,14380,11145,4736,3381)
INSERT INTO #c VALUES('SAP',2009,10672,6980,2588,1748)
INSERT INTO #c VALUES('SAP',20,11575,7370,2701,1847)
INSERT INTO #c VALUES('SAP',2007,10256,6631,2698,1906)
INSERT INTO #c VALUES('SAP',2006,9393,6064,2578,1871)
INSERT INTO #c VALUES('SAP',2005,8509,5460,2337,1496)
Now, calculate the population covariance of the revenue (REV) againt the year (YE) for each company (SYM)
SELECT #c.SYM
,wct.COVARIANCE_P(REV,YE) as COVARIANCE_P
FROM #c
GROUP BY SYM
This produces the following result.
SYM COVARIANCE_P
----- ----------------------
GOOG -2391797.4724
MSFT -2007485.8
ORCL -572242.24
SAP -592712.8
YHOO 1973130.6128
Let’s say we wanted to perform the same analysis as above, but we only want to return the results where the covariance is positive.
SELECT #c.SYM
,wct.COVARIANCE_P(REV,YE) as COVARIANCE_P
FROM #c
GROUP BY SYM
HAVING wct.COVARIANCE_P(REV,YE) > 0
This produces the following result.
SYM COVARIANCE_P
----- ----------------------
YHOO 1973130.6128
In this example, we will calculate the correlation of the operating income (OPINC) against the revenue (REV)
SELECT #c.SYM
,wct.COVARIANCE_P(OPINC,REV) as COVARIANCE_P
FROM #c
GROUP BY SYM
This produces the following result.
SYM COVARIANCE_P
----- ----------------------
GOOG 12281522.966476
MSFT 19038574.4
ORCL 6855059.76
SAP 117904.8
YHOO 676127.183864