NCTCDF
Updated: 31 July 2010
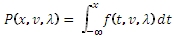
Use NCTCDF to calculate the lower cumulative distribution function of the non-central T distribution.
The formula for the lower cumulative distribution function is:
Syntax
SELECT [wctStatistics].[wct].[NCTCDF] (
<@X, float,>
,<@DF, float,>
,<@Delta, float,>)1
Arguments
@X
is the variable to be evaluated. @X is an expression of type float or of a type that implicitly converts to float.
@DF
degrees of freedom. @DF is an expression of type float or of a type that implicitly converts to float.
@Delta
is the non-centrality parameter. @Delta is an expression of type float or of a type that implicitly converts to float.
Return Types
float
Remarks
· @X must be greater than zero (@X > 0).
· @DF must be greater than zero (@DF > 0).
· @Lambda must be greater than or equal to zero (@Lambda > 0).
Examples
Calculate the lower cumulative distribution function:
SELECT wct.NCTCDF(1,3,3)
This produces the following result
----------------------
0.0270004801469904
(1 row(s) affected)
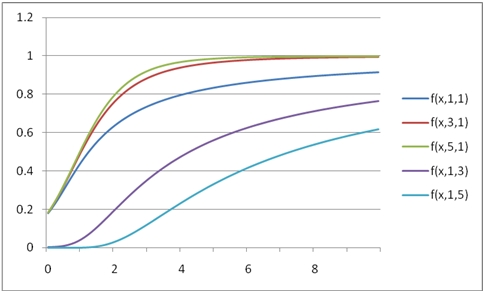
You can use the SeriesFloat function from the XLeratorDB/math library to generate a dataset which can be pasted into EXCEL to generate a graph of the cumulative distribution function.
SELECT SeriesValue
,wct.NCFCDF(SeriesValue, 1, 1, 1) as [f(x,1,1,1)]
,wct.NCFCDF(SeriesValue, 1, 2, 1) as [f(x,1,2,1)]
,wct.NCFCDF(SeriesValue, 2, 1, 2) as [f(x,2,1,2)]
,wct.NCFCDF(SeriesValue, 2, 2, 1) as [f(x,2,2,1)]
,wct.NCFCDF(SeriesValue, 3, 1, 2) as [f(x,3,1,2)]
FROM wctMath.wct.SeriesFloat(.1, 10, .1,NULL,NULL)
This is an EXCEL-generated graph of the results
Calculate the upper cumulative distribution:
SELECT 1 - wct.NCTCDF(1,3,3)
This produces the following result
----------------------
0.97299951985301
(1 row(s) affected)