MONOSPLINE
Updated: 25 August 2013
Use the aggregate function MONOSPLINE to calculate the interpolated value of y given x in the array (x, y). MONOSPLINE is an implementation of Monotonic Piecewise Cubic Interpolation by F. N. Fritsch and R. E. Carlson, SIAM Journal on Numerical Analysis, Vol. 17, No.2 (Apr., 1980), pp. 238–246.
Syntax
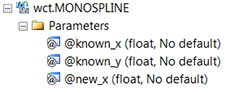
Arguments
@known_x
the x-values to be used in the interpolation calculation. @known_x must be of the type float or of a type that implicitly converts to float.
@known_y
the y-values to be used in the interpolation calculation. @known_y must be of the type float or of a type that implicitly converts to float.
@new_x
the new x-value for which you want MONOSPLINE to calculate the y-value.
Return Types
float
Remarks
· For linear interpolation use the INTERP function.
· For cubic spline interpolation use the SPLINE function.
· For polynomial interpolation use the POLYINTERP function.
· If an x-y pair contains a NULL, then the pair is not used in the interpolation calculation.
· If a @known_x value occurs more than once in the dataset and error message will be generated.
· If @new_x is less than the minimum @known_x then the @known_y value for the minimum @known_x will be returned.
· If @new_x is greater than the maximum @known_x then the @known_y value for the maximum @known_x will be returned.
· @new_x must remain invariant for the GROUP.
Examples
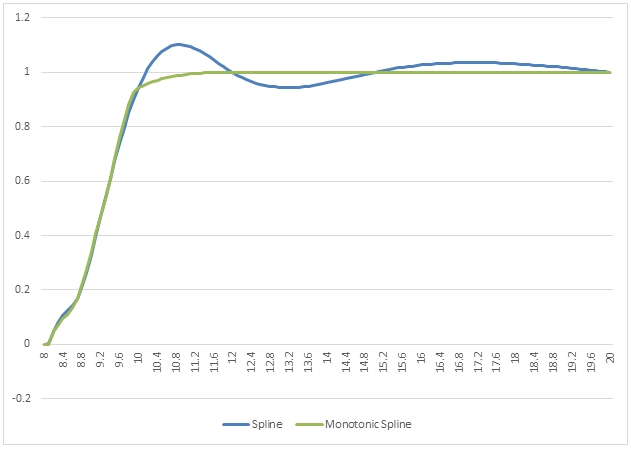
In this example, we will use the data provided by Fritsch and Carlson in their paper and compare the monotonic cubic spline to the natural cubic spline. We will generate new x-values in the range 8 to 20 in increments of 0.1 using the SeriesFloat function.
SELECT k.seriesvalue as new_x
,wct.SPLINE(x,y,k.seriesvalue) as Spline
,wct.MONOSPLINE(x,y,k.seriesvalue) as [Monotonic Spline]
FROM (VALUES
(7.99,0),
(8.09,2.76429E-05),
(8.19,4.37498E-02),
(8.7,0.169183),
(9.2,0.469428),
(10,0.943740),
(12,0.998636),
(15,0.999919),
(20,0.999994)
)n(x,y)
CROSS APPLY wct.SeriesFloat(8,20,0.1,NULL,NULL)k
GROUP BY k.seriesvalue
Here are the first few rows of the resultant table.
Here’s a graph of the resultant table using Excel.
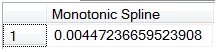
If we had simply wanted to get an interpolated value for a single point, we could have entered the following SQL.
SELECT wct.MONOSPLINE(x,y,12.5) as [Monotonic Spline]
FROM (VALUES
(7.99,0),
(8.09,2.76429E-05),
(8.19,4.37498E-02),
(8.7,0.169183),
(9.2,0.469428),
(10,0.943740),
(12,0.998636),
(15,0.999919),
(20,0.999994)
)n(x,y)
This produces the following result.
Here is another example.
SELECT k.seriesvalue as new_x
,wct.SPLINE(x,y,k.seriesvalue) as Spline
,wct.MONOSPLINE(x,y,k.seriesvalue) as [Monotonic Spline]
FROM (VALUES
(0,10),
(2,10),
(3,10),
(5,10),
(6,10),
(8,10),
(9,10.5),
(11,15),
(12,50),
(14,60),
(15,85)
)n(x,y)
CROSS APPLY wct.SeriesFloat(0,15,0.1,NULL,NULL)k
GROUP BY k.seriesvalue
Here are the first few rows from the resultant table.
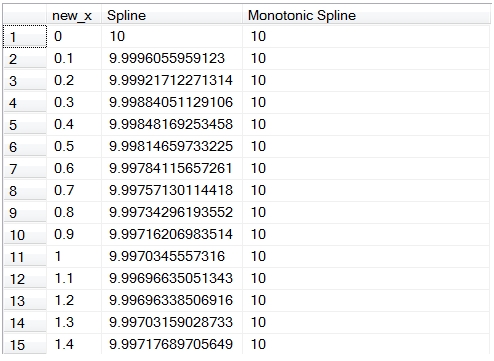
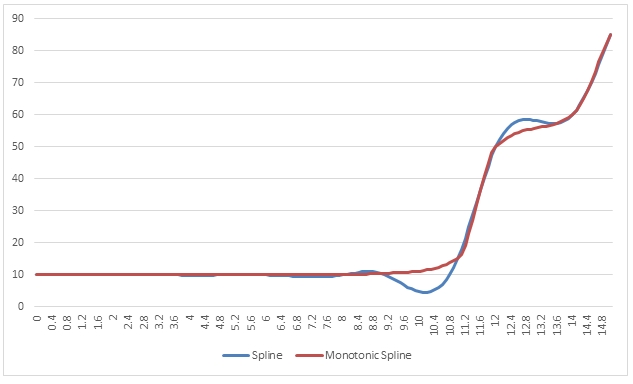
Here are the results graphed in EXCEL.
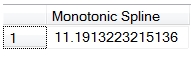
As in the previous example, we could specified a single point rather than a series of points for the new x-value.
SELECT wct.MONOSPLINE(x,y,10) as [Monotonic Spline]
FROM (VALUES
(0,10),
(2,10),
(3,10),
(5,10),
(6,10),
(8,10),
(9,10.5),
(11,15),
(12,50),
(14,60),
(15,85)
)n(x,y)
This produces the following result.
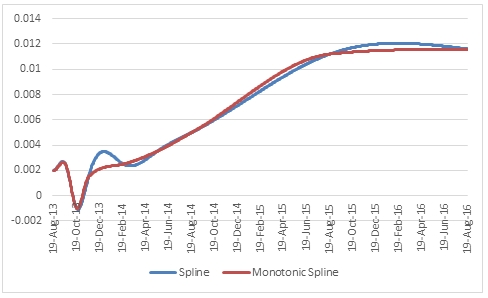
In this example, we will interpolate using dates.
SELECT k.seriesvalue as new_x
,wct.SPLINE(cast(cast(x as datetime) as float),y,CAST(k.SeriesValue as float)) as Spline
,wct.MONOSPLINE(cast(cast(x as datetime) as float),y,CAST(k.SeriesValue as float)) as [Monotonic Spline]
FROM (VALUES
('2013-08-19',.0020),
('2013-08-20',.0020),
('2013-08-21',.0020),
('2013-09-21',.0025),
('2013-10-21',-.0010),
('2013-11-21',.0015),
('2014-02-21',.0025),
('2014-05-21',.0035),
('2014-08-21',.0050),
('2015-08-21',.0112),
('2016-08-21',.0116)
)n(x,y)
CROSS APPLY wct.SeriesDate('2013-08-19','2016-08-19',1,NULL,NULL)k
GROUP BY k.seriesvalue
Here are the first few rows in the resultant table.
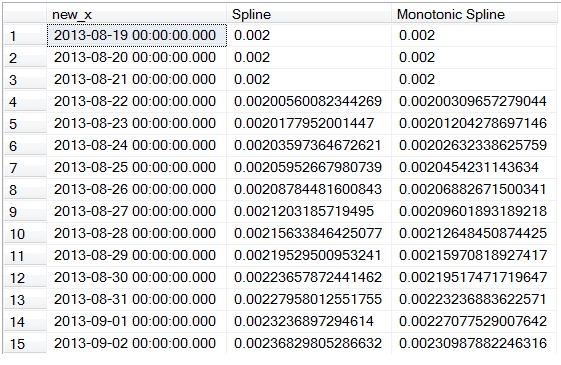
Here is a graph of the result in EXCEL.
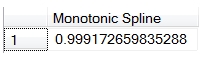
Of course, we could specify a single point rather than a series of points.
SELECT wct.MONOSPLINE(cast(cast(x as datetime) as float),y,westclintech.wct.DATEFLOAT(2014,07,21)) as [Monotonic Spline]
FROM (VALUES
('2013-08-19',.0020),
('2013-08-20',.0020),
('2013-08-21',.0020),
('2013-09-21',.0025),
('2013-10-21',-.0010),
('2013-11-21',.0015),
('2014-02-21',.0025),
('2014-05-21',.0035),
('2014-08-21',.0050),
('2015-08-21',.0112),
('2016-08-21',.0116)
)n(x,y)
This produces the following result.