LOGITPROB
Updated: 27 February 2015
Use the multi-input aggregate function LOGITPROB to calculate the probability that Y = 1 given a set of coefficients from a logistic regression and a set of x-values. The probability is estimated as:
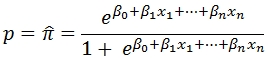
The coefficients and x-values are passed into the function as pairs, which requires passing a 1 (for the intercept) into the function for ß0 coefficient.
Syntax
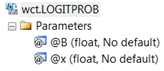
@B
the coefficients from a logit regression. @B must be of the type float or of a type that implicitly converts to float.
@x
the x-value associated with coefficient. @x should be consistent with the independent variables used in the logit regression. @x must be of the type float or of a type that implicitly converts to float.
Return Types
float
Remarks
· You should pass a 1 with the ß0 coefficient.
Examples
We will run a logistic regression on the following data and then compare the observed y-value to the predicted y-value using the LOGITPROB function. We will use the LOGITSUM function to calculate the coefficients.
|
Temp
|
Water
|
Male
|
Female
|
|
20
|
0
|
21
|
0
|
|
21
|
0
|
90
|
6
|
|
22
|
0
|
91
|
23
|
|
23
|
0
|
61
|
73
|
|
24
|
0
|
11
|
41
|
|
25
|
0
|
4
|
28
|
|
20
|
1
|
18
|
4
|
|
21
|
1
|
75
|
9
|
|
22
|
1
|
68
|
21
|
|
23
|
1
|
59
|
65
|
|
24
|
1
|
17
|
46
|
|
25
|
1
|
7
|
22
|
--Put the data into a table
SELECT
IDENTITY(INT,1,1) as rn
,*
,male / CAST(male + female as float) as y_obs
INTO
#t
FROM(
VALUES
(20,0,21,0)
,(21,0,90,6)
,(22,0,91,23)
,(23,0,61,73)
,(24,0,11,41)
,(25,0,4,28)
,(20,1,18,4)
,(21,1,75,9)
,(22,1,68,21)
,(23,1,59,65)
,(24,1,17,46)
,(25,1,7,22)
)n(temp,water,male,female)
--Perform the regression
SELECT
*
INTO
#coef
FROM
wct.LOGITSUM('SELECT temp,water,male,female FROM #T',3,4)
--Put the new x-values into 3rd normal form
SELECT
#t.rn
,n.idx
,n.x
INTO
#newx
FROM
#t
CROSS APPLY(VALUES (0,1),(1,temp),(2,water))n(idx,x)
--Calculate the predicted y-values and compare
--to the observed y-values
SELECT
t.temp
,t.water
,t.y_obs
,wct.LOGITPROB(a.stat_val,b.x) as y_pred
FROM
#newx b
JOIN
#coef a
ON
b.idx = a.idx
JOIN
#t t
ON
b.rn = t.rn
WHERE
a.stat_name = 'b'
GROUP BY
b.rn
,t.temp
,t.water
,t.y_obs
ORDER BY
b.rn
This produces the following result.
temp water y_obs y_pred
----------- ----------- ---------------------- ----------------------
20 0 1 0.962666164888472
21 0 0.9375 0.898550857816897
22 0 0.798245614035088 0.752621841432599
23 0 0.455223880597015 0.511014157141803
24 0 0.211538461538462 0.264148436577182
25 0 0.125 0.109769453268386
20 1 0.818181818181818 0.961211464524059
21 1 0.892857142857143 0.89487074873382
22 1 0.764044943820225 0.745149498986974
23 1 0.475806451612903 0.501081697117896
24 1 0.26984126984127 0.25649731606484
25 1 0.241379310344828 0.105946142147757
Using the data from Example #2 in the LOGIT documentation, which used http://www.ats.ucla.edu/stat/data/binary.csv as input into a table called #mydata, we calculated the coefficients using the following the SQL which stores the results in table called #mylogit.SELECT
*
INTO
#mylogit
FROM
wct.LOGIT(
'SELECT
admit
,gre
,gpa
,CASE RANK
WHEN 2 THEN 1
ELSE 0
END
,CASE RANK
WHEN 3 THEN 1
ELSE 0
END
,CASE RANK
WHEN 4 THEN 1
ELSE 0
END
FROM
#mydata'
,1
)
Remember that gre and gpa as treated as continuous data while rank has been treated as discrete data. The possible values for rank are 1, 2, 3, 4.
As in the examples at R Data Analysis Examples: Logit Regression which can be found at www.ats.ucla.edu/stat/r/dae/logit.htm we calculate the predicted probability of admission at each value of rank by holding gre and gpa at their means.
SELECT
ROUND(n.gre, 0) as gre
,ROUND(n.gpa, 2) as gpa
,n.rank
,ROUND(wct.LOGITPROB(b.stat_val,x.x),3) as y_pred
FROM (
SELECT
AVG(cast(gre as float)) as gre
,AVG(cast(gpa as float)) as gpa
,k.SeriesValue as [rank]
,CASE k.SeriesValue
WHEN 2 THEN 1
ELSE 0
END as rank2
,CASE k.SeriesValue
WHEN 3 THEN 1
ELSE 0
END as rank3
,CASE k.SeriesValue
WHEN 4 THEN 1
ELSE 0
END as rank4
FROM
#mydata
CROSS APPLY wct.SeriesInt(1,4,NULL,NULL,NULL)k
GROUP BY
k.SeriesValue
)n
CROSS APPLY(VALUES (0,1),(1,gre),(2,gpa),(3,rank2),(4,rank3),(5,rank4))x(idx,x)
JOIN
#mylogit b
ON
x.idx = b.idx
WHERE
b.stat_name = 'b'
GROUP BY
n.gre
,n.gpa
,n.rank
This produces the following result.
gre gpa rank y_pred
--- ---- ---- ------
588 3.39 1 0.517
588 3.39 2 0.352
588 3.39 3 0.219
588 3.39 4 0.185
We can see from the above output that the predicted probability of success is 0.517 when the rank is 1 and 0.185 when the rank is 4 holding gre and gpa at their means.
See Also