TPDF
Updated: 31 July 2010
Use TPDF to calculate the probability density function of the T distribution.
The formula for the probability density function is:
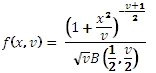
Where
x the t-statistic
v the degrees of freedom
B the Beta function
Syntax
SELECT [wctStatistics].[wct].[TPDF] (
<@X, float,>
,<@Degrees_freedom, float,>)
Arguments
@X
the variable to be evaluated. @X is an expression of type float or of a type that implicitly converts to float.
@Degrees_Freedom
is the degrees of freedom. @Degrees_Freedom is an expression of type float or of a type that implicitly converts to float.
Return Types
float
Remarks
· @Degrees_Freedom must be greater than zero (@DF > 0).
Examples
Calculate the probability density function:
SELECT wct.TPDF(1,3) as [T pdf]
This produces the following result
T pdf
----------------------
0.206748335783172
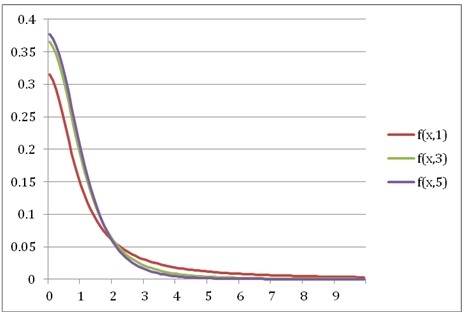
You can use the SeriesFloat function from the XLeratorDB/math module to generate a dataset which can be pasted into EXCEL to generate a graph of the probability density function.
SELECT SeriesValue
,wct.NCTPDF(SeriesValue, 1, 1) as [f(x,1,1)]
,wct.NCTPDF(SeriesValue, 3, 1) as [f(x,3,1)]
,wct.NCTPDF(SeriesValue, 5, 1) as [f(x,5,1)]
,wct.NCTPDF(SeriesValue, 1, 3) as [f(x,1,3)]
,wct.NCTPDF(SeriesValue, 1, 5) as [f(x,1,5)]
FROM wctMath.wct.SeriesFloat(.1, 10, .1,NULL,NULL)
This is an EXCEL-generated graph of the results