TTEST
Updated: 28 February 2011
Note: This documentation is for the SQL2008 (and later) version of this XLeratorDB function, it is not compatible with SQL Server 2005.
Click here for the SQL2005 version of the TTEST function
Use TTEST to calculate the probability associated with Student’s t-test. Use TTEST to determine whether two samples are likely to have come from the same two underlying populations that have the same mean.Syntax
Arguments
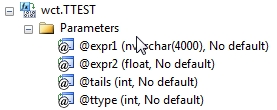
@expr1
a label that identifies the group that @expr2 belongs to. The lables would identify, for example, if @expr2 was a value belonging to the test group or the control group.
@expr2
the values supplied to the calculation. @expr2 is an expression of type float or of a type that can be implicitly converted to float.
@Tails
specifies the number of distribution tails. If tails = 1, TTEST uses the one-tailed distribution. If tails = 2, TTEST uses the two-tailed distribution.
@Ttype
is the kind of TTEST to perform. If @Ttype =1, perform the paired test. If @Ttype = 2, perform the two-sample equal variance test. If @Ttype = 3, perform the two-sample unequal variance test.
Return Types
float
Remarks
· If the number of rows in dataset 1 or dataset 2 have a different number of data points and @Ttype = 1, TTEST returns an error.
· If @Tails is any value other than 1 or 2, TTEST returns an error.
· If @Ttype is any value other than 1, 2 or 3, TTEST returns an error.
· TTEST is designed for normalized tables. For de-normalized tables you can normalize your data using the UNPIVOT function, or look at the examples using CROSS APPLY, or consider using the TTEST_q function.
· @Tails must be invariant within a GROUP.
· @TType must be invariant within a GROUP.
· TTEST is an aggregate function and follows the same conventions as all other aggregate function in SQL Server.
· If you have previously used the TTEST scalar function, the TTEST aggregate has a different syntax. The TTEST scalar function is no longer available in XLeratorDB/statistics2008 though you can still use TTEST_q.
Examples
To calculate the probability associated with a Student's paired t-Test, with a one-tailed distribution we would enter the following:
SELECT wct.TTEST(label, x, 1, 1) as TTEST
FROM (VALUES
('d1',154.3),('d2',230.4),
('d1',191),('d2',202.8),
('d1',163.4),('d2',202.8),
('d1',168.6),('d2',216.8),
('d1',187),('d2',192.9),
('d1',200.4),('d2',194.4),
('d1',162.5),('d2',211.7)
) n(label, x)
This produces the following result
TTEST
----------------------
0.0134150262823473
(1 row(s) affected)
To calculate the probability associated with a Student's paired t-Test, with a two-tailed distribution we would enter the following:
SELECT wct.TTEST(label, x, 2, 1) as TTEST
FROM (VALUES
('d1',154.3),('d2',230.4),
('d1',191),('d2',202.8),
('d1',163.4),('d2',202.8),
('d1',168.6),('d2',216.8),
('d1',187),('d2',192.9),
('d1',200.4),('d2',194.4),
('d1',162.5),('d2',211.7)
) n(label, x)
This produces the following result
TTEST
----------------------
0.0268300525646946
(1 row(s) affected)
In this example, we have the same data, but instead the data being normalized, it is presented to us as two columns of data, the way it might be in a spreadsheet.
SELECT wct.TTEST(label, x, 2, 1) as TTEST
FROM (VALUES
(154.3, 230.4),
(191, 202.8),
(163.4, 202.8),
(168.6, 216.8),
(187, 192.9),
(200.4, 194.4),
(162.5, 211.7)
) n(d1, d2)
CROSS APPLY(VALUES
('d1',d1),
('d2',d2)
) m(label, x)
This produces the following result.
TTEST
----------------------
0.0268300525646946
(1 row(s) affected)
To calculate the probability associated with a Student's two sample equal variance t-Test, with a one-tailed distribution where the number of rows in each group is not equal:
SELECT wct.TTEST(label, x, 1, 2) as TTEST
FROM (VALUES
('d1',165.9)
,('d1',210.3)
,('d1',166.8)
,('d1',182.3)
,('d1',182.1)
,('d1',218)
,('d1',170.1)
,('d2',212.1)
,('d2',203.5)
,('d2',210.3)
,('d2',228.4)
,('d2',206.2)
,('d2',203.2)
,('d2',224.9)
,('d2',202.6)
) n(label, x)
This produces the following result
TTEST
----------------------
0.00376520013779417
(1 row(s) affected)
To calculate the probability associated with a Student's two sample equal variance t-Test, with a two-tailed distribution:
SELECT wct.TTEST(label, x, 2, 2) as TTEST
FROM (VALUES
('d1',165.9)
,('d1',210.3)
,('d1',166.8)
,('d1',182.3)
,('d1',182.1)
,('d1',218)
,('d1',170.1)
,('d2',212.1)
,('d2',203.5)
,('d2',210.3)
,('d2',228.4)
,('d2',206.2)
,('d2',203.2)
,('d2',224.9)
,('d2',202.6)
) n(label, x)
This produces the following result
TTEST
----------------------
0.00753040027558833
(1 row(s) affected)
In this example, we have the same data, but instead the data being normalized, it is presented to us as two columns of data, the way it might be in a spreadsheet.
SELECT wct.TTEST(label, x, 2, 2) as TTEST
FROM (VALUES
(212.1,165.9),
(203.5,210.3),
(210.3,166.8),
(228.4,182.3),
(206.2,182.1),
(203.2,218),
(224.9,170.1),
(202.6,NULL)
) n(d1, d2)
CROSS APPLY(VALUES
('d1',d1),
('d2',d2)
) m(label, x)
This produces the following result.
TTEST
----------------------
0.00753040027558833
(1 row(s) affected)
To calculate the probability associated with a Student's two sample unequal variance t-Test, with a one-tailed distribution:
SELECT wct.TTEST(label, x, 1, 3) as TTEST
FROM (VALUES
('d1',165.9)
,('d1',210.3)
,('d1',166.8)
,('d1',182.3)
,('d1',182.1)
,('d1',218)
,('d1',170.1)
,('d2',212.1)
,('d2',203.5)
,('d2',210.3)
,('d2',228.4)
,('d2',206.2)
,('d2',203.2)
,('d2',224.9)
,('d2',202.6)
) n(label, x)
This produces the following result
TTEST
----------------------
0.00789274282536698
(1 row(s) affected)
To calculate the probability associated with a Student's two sample unequal variance t-Test, with a two-tailed distribution:
SELECT wct.TTEST(label, x, 2, 3) as TTEST
FROM (VALUES
('d1',165.9)
,('d1',210.3)
,('d1',166.8)
,('d1',182.3)
,('d1',182.1)
,('d1',218)
,('d1',170.1)
,('d2',212.1)
,('d2',203.5)
,('d2',210.3)
,('d2',228.4)
,('d2',206.2)
,('d2',203.2)
,('d2',224.9)
,('d2',202.6)
) n(label, x)
This produces the following result
TTEST
----------------------
0.015785485650734
(1 row(s) affected)
In this example, we have multiple sample groups and we want to run them all against a sample control group.
;with t as (
SELECT *
FROM (VALUES
('Control', 1, 88.21336),
('Control', 2, 80.60727),
('Control', 3, 109.1178),
('Control', 4, 95.97753),
('Control', 5, 102.2594),
('Control', 6,101.6824),
('Sample 1',1,105.27007),
('Sample 1',2,118.73855),
('Sample 1',3,80.28907),
('Sample 1',4,94.33473),
('Sample 1',5,111.54195),
('Sample 1',6,87.62568),
('Sample 2',1,97.64904),
('Sample 2',2,105.44544),
('Sample 2',3,93.00511),
('Sample 2',4,98.10938),
('Sample 2',5,110.6038),
('Sample 2',6,102.67528),
('Sample 3',1,88.29694),
('Sample 3',2,67.93632),
('Sample 3',3,75.47897),
('Sample 3',4,90.02577),
('Sample 3',5,89.44848),
('Sample 3',6,108.20771)
) n(sample_num, seq, val)
) SELECT a.sample_num, wct.TTEST(b.sample_num, b.val, 1, 1) as TTEST
FROM t a, t b
WHERE a.sample_num <> 'CONTROL' AND(b.sample_num = a.sample_num or b.sample_num = 'Control')
AND a.seq = b.seq
GROUP BY a.sample_num
This produces the following result.
sample_num TTEST
---------- ----------------------
Sample 1 0.372324541579079
Sample 2 0.203616142365002
Sample 3 0.0731820492871307
(3 row(s) affected)