SFTEST
Updated: 27 June 2012
Note: This documentation is for the SQL2008 (and later) version of this XLeratorDB function, it is not compatible with SQL Server 2005.
Click here for the SQL2005 version of the SFTEST function
Use the aggregate function SFTEST to perform the Shapiro-Francia test for the composite hypothesis of normality. The test statistic of the Shapiro-Francia test is simply the squared correlation between the ordered sample values and the (approximated) expected ordered quantiles from the standard normal distribution. The p-value is computed from the formula given by Royston (1993).Syntax
Arguments
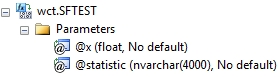
@x
the sample values. @x is an expression of type float or of a type that can be implicitly converted to float.
@statistic
identifies the return value as either the Shapiro-Francia statistic (w) or the p-value (p).
Return Types
float
Remarks
· If @x is null then @x is not included in the aggregate.
· @statistic must be invariant for the GROUP.
· SFTEST is an aggregate function and follows the same conventions as all other aggregate functions in SQL Server.
· @x must have at least 3 rows
Examples
In this example, we have two samples, which we have identified as sample 1 and sample 2 and we perform the Shapiro Francia test on both in a single SELECT, grouping the results by sample number.
SELECT n.s as sample_num
,wct.SFTEST(x,'w') as w_observed
,wct.SFTEST(x,'p') as p_value
FROM (VALUES
(1,0.11),(2,3.49),
(1,7.87),(2,1.36),
(1,4.61),(2,1.14),
(1,10.14),(2,2.92),
(1,7.95),(2,2.55),
(1,3.14),(2,1.46),
(1,0.46),(2,1.06),
(1,4.43),(2,5.27),
(1,0.21),(2,-1.11),
(1,4.75),(2,3.48),
(1,0.71),(2,1.10),
(1,1.52),(2,0.88),
(1,3.24),(2,-0.51),
(1,0.93),(2,1.46),
(1,0.42),(2,0.52),
(1,4.97),(2,6.20),
(1,9.53),(2,1.69),
(1,4.55),(2,0.08),
(1,0.47),(2,3.67),
(1,6.66),(2,2.81)
) n(s,x)
GROUP BY n.s
This produces the following result
sample_num w_observed p_value
----------- ---------------------- ----------------------
1 0.917024201827551 0.0810926381951407
2 0.956959220606241 0.411915065401292