COVARIANCE_S
Updated: 24 May 2013
Note: This documentation is for the SQL2008 (and later) version of this XLeratorDB function, it is not compatible with SQL Server 2005.
Click here for the SQL2005 version of the COVARIANCE_S function
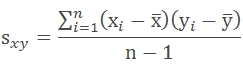
Use the aggregate function COVARIANCE_S to calculate the sample covariance for a set of x- and y-values. The formula for the population covariance is
Syntax
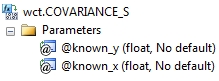
@Known_y
the y-values to be used in the calculation. @Known_y is an expression of type float or of a type that can be implicitly converted to float.
@Known_x
the x-values to be used in the calculation. @Known_x is an expression of type float or of a type that can be implicitly converted to float.
Return Types
float
Remarks
· COVARIANCE_S is an AGGREGATE function and follows the same conventions as all other AGGREGATE functions in SQL Server.
Examples
In this example, we calculate the sample covariance for a single set of x- and y-values
SELECT wct.COVARIANCE_S(y, x) as COVARIANCE_S
FROM (
SELECT 0.75, 1 UNION ALL
SELECT 2.5, 2 UNION ALL
SELECT 6.75, 3 UNION ALL
SELECT 10, 4
) n(x,y)
This produces the following result
COVARIANCE_S
----------------------
5.33333333333333
In this example, we will populate some temporary table with some historical financial information and then calculate the sample covariance. First, create the table and put some data in it:
CREATE TABLE #c(
SYM NVARCHAR(5),
YE BIGINT,
REV FLOAT,
GPROF FLOAT,
OPINC FLOAT,
NETINC FLOAT
)
INSERT INTO #c VALUES('YHOO',2009,6460.32,3588.57,386.69,597.99)
INSERT INTO #c VALUES('YHOO',20,72.5,4185.14,12.96,418.92)
INSERT INTO #c VALUES('YHOO',2007,6969.27,4130.52,695.41,639.16)
INSERT INTO #c VALUES('YHOO',2006,6425.68,3749.96,940.97,751.39)
INSERT INTO #c VALUES('YHOO',2005,5257.67,3161.47,1107.73,1896.23)
INSERT INTO #c VALUES('GOOG',2009,23650.56,14806.45,8312.19,6520.45)
INSERT INTO #c VALUES('GOOG',20,21795.55,13174.04,5537.21,4226.86)
INSERT INTO #c VALUES('GOOG',2007,16593.99,9944.9,54.44,4203.72)
INSERT INTO #c VALUES('GOOG',2006,10604.92,6379.89,3550,3077.45)
INSERT INTO #c VALUES('GOOG',2005,6138.56,3561.47,2017.28,1465.4)
INSERT INTO #c VALUES('MSFT',2010,62484,509,24167,18760)
INSERT INTO #c VALUES('MSFT',2009,58437,46282,21225,14569)
INSERT INTO #c VALUES('MSFT',20,60420,48822,22271,17681)
INSERT INTO #c VALUES('MSFT',2007,51122,40429,18438,14065)
INSERT INTO #c VALUES('MSFT',2006,44282,36632,16064,12599)
INSERT INTO #c VALUES('ORCL',2010,26820,21056,9062,6135)
INSERT INTO #c VALUES('ORCL',2009,23252,18458,8321,5593)
INSERT INTO #c VALUES('ORCL',20,22430,17449,7844,5521)
INSERT INTO #c VALUES('ORCL',2007,17996,13805,5974,4274)
INSERT INTO #c VALUES('ORCL',2006,14380,11145,4736,3381)
INSERT INTO #c VALUES('SAP',2009,10672,6980,2588,1748)
INSERT INTO #c VALUES('SAP',20,11575,7370,2701,1847)
INSERT INTO #c VALUES('SAP',2007,10256,6631,2698,1906)
INSERT INTO #c VALUES('SAP',2006,9393,6064,2578,1871)
INSERT INTO #c VALUES('SAP',2005,8509,5460,2337,1496)
Now, calculate the population covariance of the revenue (REV) againt the year (YE) for each company (SYM)
SELECT #c.SYM
,wct.COVARIANCE_S(REV,YE) as COVARIANCE_S
FROM #c
GROUP BY SYM
This produces the following result.
SYM COVARIANCE_S
----- ----------------------
GOOG -2989746.8405
MSFT -2509357.25
ORCL -715302.8
SAP -740891
YHOO 2466413.266
Let’s say we wanted to perform the same analysis as above, but we only want to return the results where the covariance is positive.
SELECT #c.SYM
,wct.COVARIANCE_S(REV,YE) as COVARIANCE_S
FROM #c
GROUP BY SYM
HAVING wct.COVARIANCE_S(REV,YE) > 0
This produces the following result.
SYM COVARIANCE_S
----- ----------------------
YHOO 2466413.266
In this example, we will calculate the correlation of the operating income (OPINC) against the revenue (REV)
SELECT #c.SYM
,wct.COVARIANCE_S(OPINC,REV) as COVARIANCE_S
FROM #c
GROUP BY SYM
This produces the following result.
SYM COVARIANCE_S
----- ----------------------
GOOG 15351903.708095
MSFT 23798218
ORCL 8568824.7
SAP 147381
YHOO 845158.97983