One pass or two?
Sep
29
Written by:
Charles Flock
9/29/2010 5:18 PM

A look at the numerical accuracy of SQL Server’s aggregate functions, the limits of floating-point math, and other interesting stuff we discovered while implementing multi-input aggregate functions in SQL Server 2008.
Versions of EXCEL prior to EXCEL 2003 were criticized extensively for inaccurate results in some of the EXCEL statistical functions like VAR, VARP, STDEV, STDEVP, SLOPE, etc. While most of the cases cited in these criticisms were unlikely to occur in real world analyses, Microsoft apparently thought enough of the objections that it re-worked them in EXCEL 2003.
SQL Server contains the VAR, VARP, STDEV, and STDEVP functions. We have also implemented versions of these functions in XLeratorDB. The XLeratorDB implementation matches the accuracy of the EXCEL 2003/2007/2010 versions of the functions. Today we will look at why the SQL Server built-in aggregate functions do not.
Let’s start with the VAR function, which calculates sample variance. The formula for sample variance is:
We will create a very simple table and populate it with some data to see how it behaves.
CREATE TABLE #n(
x float
)
INSERT INTO #n VALUES (6)
INSERT INTO #n VALUES (4)
INSERT INTO #n VALUES (2)
INSERT INTO #n VALUES (1)
INSERT INTO #n VALUES (3)
INSERT INTO #n VALUES (5)
Let’s calculate the sample variance using the built-in VAR function.
SELECT VAR(x) as VAR
FROM #n
This produces the following result.
VAR
----------------------
3.5
(1 row(s) affected)
We can actually verify that calculation using the following statement.
SELECT SUM(SQUARE(x - m.mean))/(m.n-1) as [COMPUTED VAR]
FROM (
SELECT AVG(x) as mean, count(x) as n
FROM #n
) m, #n
GROUP BY m.n
This produces the following result.
COMPUTED VAR
----------------------
3.5
(1 row(s) affected)
Now, we are going to add 10,000,000,000 to all the x-values.
UPDATE #n
SET x = x + 1E10
When we calculate the variance on the new x-values,
SELECT VAR(x) as VAR
FROM #n
the following result is returned.
VAR
----------------------
0
(1 row(s) affected)
Zero? Can that really be right? Let’s look at what our independent verification returns.
SELECT SUM(SQUARE(x - m.mean))/(m.n-1) as [COMPUTED VAR]
FROM (
SELECT AVG(x) as mean, count(x) as n
FROM #n
) m, #n
GROUP BY m.n
This produces the following result,
VAR
----------------------
3.5
(1 row(s) affected)
which agrees with the XLeratorDB calculation:
SELECT wct.VAR('#n','x','',NULL) as [XLDB VAR]
This produces the following result.
XLDB VAR
----------------------
3.5
(1 row(s) affected)
The sample variance takes the sum of the square of the difference between each x and the average x SUM(SQUARE(x - m.mean)). Adding 1E10 to every x does not change that value, and the number of values, COUNT(x), has not changed.
The calculation method used in XLeratorDB and in the computed VAR SQL both rely on a two-pass process. In the first pass, we calculated the mean, AVG(x), and the count. In the second pass, the sum of the square of the differences between x and the mean is calculated and divided by the count minus one. Even though it is a single SELECT statement, it is a two-pass process.
There is a one-pass process to calculate sample variance. That formula is,
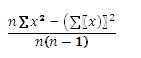
which we can represent in the following SELECT.
SELECT (SUM(SQUARE(x))-SQUARE(SUM(x))/count(x))/(count(x) - 1)
FROM #n
If we subtract 1e10 from all the x-values,
UPDATE #n
SET x = x-1E10
and run the following SELECT,
SELECT (SUM(SQUARE(x))-SQUARE(SUM(x))/count(x))/(count(x) - 1) as [One-Pass VAR]
FROM #n
we get the following result.
One-Pass VAR
----------------------
3.5
(1 row(s) affected)
Adding 1e10 to all the x-values,
UPDATE #n
SET x = x+1E10
and running the SQL again,
One-Pass VAR
----------------------
0
(1 row(s) affected)
we can see that we replicated the SQL Server result. This mirrors the result that we got from the built-in function.
Is this actually what SQL Server is doing internally? Probably not. I say this because we discovered some interesting things about user defined aggregate functions while building some multi-input aggregates in SQL 2008.
First, and this should be obvious (but it wasn’t to me), is that you cannot perform an aggregate function on an expression containing an aggregate or a subquery. This is actually in BOL, so it is probably something I should know, but I had to learn it over again. Thus, there is no way that the SUM and COUNT functions are being used internally in the VAR function. These values need to be calculated in the code.
Couldn’t the VAR function have used derived tables or a CTE to overcome that obstacle? No, for two reasons. First, the VAR function pre-dates the implementation of those objects in SQL Server. Second, this gives rise to the second thing we learned about aggregate functions: There is no SQL in aggregate functions. The way that I look at the aggregates is that data are streamed to you and the engine is making all the decisions about the best way to send, split, and merge the results. There is no control over the order of data and there is no way to query additional information from inside the function. The engine sends you the data and only the data.
This gives rise to another observation about user-defined aggregates. There cannot be any dependencies in the calculations. Donald Knuth proposes an alternate single-pass process for calculating the sample variance, which does not lose precision so severely. The basics of the calculation in Accumulate() look like this (where known_x is passed in and n, mean, and m2 are persistent):
n += 1
delta = Known_x.Value - mean
mean += delta / n
m2 += delta * (Known_x.Value – mean)
At first glance, this seems OK. It does not require the known_x values to be in any order and the final calculation in Terminate() is a simple division using m2 and n.
However, this implementation cannot be guaranteed to work. Since the value of m2 is dependent on the previous value of mean, there is no guarantee that the values will be correct when Merge() is completed. In fact, it seems obvious that the Merge() will behave unpredictably. What’s even worse, is that for smaller populations it will seem as though this implementation behaves predictably, but we discovered that for larger datasets, the results were not reliable.
This leads us to the following conclusion. User defined aggregates can only be used on single-pass processes. For the financial and statistical functions that we looked at, it does not seem that there is any practical way to use arrays in the calculation. We were unable to implement a two-pass calculation of VAR as a user-defined aggregate, but luckily there is no problem with a scalar implementation of VAR of the function as we have provided in XLeratorDB.
However, there is a trade-off. User-defined aggregates using single-pass process may be less accurate than two-pass processes. As we saw in our VAR example, the single-pass calculation in the built-in VAR calculation is wrong, even with just a few data points. The question is, will these conditions arise in the real world?
It was relatively easy to create data that demonstrate the inaccuracy of the calculation. In general, the inaccuracies arise because of data that contain many significant digits and relatively little variation. If we had infinite precision in computer processing, this would not be an issue. If the data you are analyzing do not meet these criteria, then the built-in VAR calculation is probably fine. And, if you want to be sure, you can always use the XLeratorDB VAR calculation which uses a two-pass method and has been benchmarked with EXCEL.
This brings me to my final observation. Single-pass aggregate functions are the fastest way to calculate the results on large datasets. We took some of our scalar functions and re-implemented them as multi-input aggregate functions in SQL Server 2008 and generally saw a 50-fold improvement in performance in our test harness. Unfortunately, we could not convert all of the two-pass functions to multi-input aggregates since they violated some of the rules we have highlighted above. For example, we could convert GROWTH to a multi-input aggregate, because there is a single-pass process, but we could not convert PERCENTILE as there is no single-pass solution.
We will be releasing a new version of our statistics package, specifically for SQL Server 2008, in the next few weeks. It will contain new multi-input aggregates for 14 of our existing functions and retain a version of the two-pass calculation as well, so XLeratorDB users will have both methods available to them.
Let’s look at the results of all four built-in functions and compare them to the two-pass methods used in XLeratorDB.
SELECT VAR(x) as VAR
,VARP(x) as VARP
,STDEV(x) as STDEV
,STDEVP(x) as STDEVP
from #n
This produces the following result.
VAR VARP STDEV STDEVP
---------------------- ---------------------- ---------------------- ----------------------
0 0 0 0
(1 row(s) affected)
Using the XLeratorDB functions:
SELECT wct.VAR('#n','x','',NULL) as [XLDB VAR]
,wct.VARP('#n','x','',NULL) as [XLDB VARP]
,wct.STDEV('#n','x','',NULL) as [XLDB STDEV]
,wct.STDEVP('#n','x','',NULL) as [XLDB STDEVP]
This produces the following result
XLDB VAR XLDB VARP XLDB STDEV XLDB STDEVP
---------------------- ---------------------- ---------------------- ----------------------
3.5 2.91666666666667 1.87082869338697 1.70782512765993
(1 row(s) affected)
As you can see, all the built-in SQL Server statistical functions have the same limitation. All the XLeratorDB functions return the same results as the EXCEL calculation. The trade-off is between speed of processing and accuracy. There is no doubt that the XLeratorDB scalar implementation of these functions will be slower. How much slower? It’s going to depend on your environment. It could be a half-second, or a half-minute. You just have to decide whether your data lends itself to the limitations of a one-pass calculation or if you need the precision of a two-pass calculation.