Calculating percentiles in SQL Server
Jul
15
Written by:
Charles Flock
7/15/2011 5:21 PM

Using the XLeratorDB/statistics 2008 PERCENTILE and PERCENTRANK functions in SQL Server 2008.
UPDATE: XLeratorDB has released a new table-valued PERCENTILE function that offers significant performance improvements over the aggregate function.
Read the new PERCENTILE article here.
If you go to Wikipedia and look up the definition of PERCENTILE, the definition starts “There is no standard definition of percentile, however all definitions yield similar results when the number of observations is very large.” If you are an EXCEL 2010 user, you might have already guessed this, since the PERCENTILE function has morphed into 2 functions; PERCENTILE.INC and PERCENTILE.EXC. If you are not an EXCEL 2010 user, you may have been scratching your head over different results produced by different packages, say EXCEL and Matlab, and wondering which is right.
Considering how often percentiles are used (height and weight charts, test scoring, performance evaluations, figuring wages, etc.) it’s important to understand the different ways to calculate percentile and what a percentile value actually means.
Generally, percentile calculations can be broken down into two functions. The first function evaluates a score (k) of some type (something like height, weight, test scores, length, etc.) within a set of scores and returns a value between 0 and 1 (p) indicating a relative ranking of that score in relation to all the other scores in the set. This ranking will indicate the percentage of scores which fall below k in the set. This is the PERCENTRANK function.
The second function evaluates a percentage (p) on a set of scores and returns a value (k) such that the percentage of scores in the set falls below k. The value k need not be a member of the set, though it is bound by the minimum and maximum values of the set. This is the PERCENTILE function.
For example, let’s say you have a 4th grade student in a class of 40 who takes a standardized exam that is given to all 4th grade students in the United States. You receive results broken down into a national percentile, a percentile for all private schools, and a percentile within school. Let’s say that this student scores in the 99th percentile nationally, 99th percentile for private schools, and the 21st percentile in-school. Is it possible to conclude that this student is near the bottom of his class and that 78% of his classmates outperformed him on this exam?
The maximum possible score on the exam is 100. In the class of 40, 32 students got a perfect score of 100, and the remaining students got a score of 99 (scores are not disclosed in the reporting of the results). Let’s calculate the value for the 21st percentile in this group.
SELECT wct.PERCENTILE(x,.21) as PERCENTILE
FROM (VALUES
(99),(99),(99),(99),(99),(99),(99),(99),
(100),(100),(100),(100),(100),(100),(100),(100),
(100),(100),(100),(100),(100),(100),(100),(100),
(100),(100),(100),(100),(100),(100),(100),(100),
(100),(100),(100),(100),(100),(100),(100),(100)
) n(x)
This produces the following result.
PERCENTILE
----------------------
100
Wait, but isn’t 100 the maximum score? How could someone get the maximum score and still be in the 21st percentile?
This gets back to the definition of percentile. While there is no standard definition, the differences in the definitions are about methods of computation rather than interpretation of the resulting statistic. The percentile statistic is the value below which a certain percent of observations fall. In this example, we know that 21 percent of the observations fall below a value of 100. We cannot draw any conclusions about how many observations are above.
Let’s look at another example. There are 40 scores in this example, with a maximum value of 300 for the score. We will calculate the 90th, 95th, and 99th percentile.
SELECT m.p as PERCENTILE
,wct.PERCENTILE(n.x,m.p) as SCORE
FROM (VALUES
(257),(261),(275),(283),(282),(261),(279),(256),
(263),(261),(283),(282),(249),(300),(257),(263),
(286),(261),(275),(245),(288),(267),(292),(255),
(279),(270),(300),(286),(285),(297),(278),(300),
(260),(269),(264),(273),(256),(300),(300),(290)
) n(x)
CROSS APPLY(VALUES (.90),(.95),(.99)) m(p)
GROUP BY m.p
ORDER BY 1
This produces the following result.
PERCENTILE SCORE
--------------------------------------- ----------------------
0.90 300
0.95 300
0.99 300
We can see that all three percentiles contain the maximum score, so all we can safely conclude is that a score of 300 is better than 90% of the reported scores. Since 300 is the maximum score, there is no ‘room for improvement’ for scores in the 90th percentile. Furthermore, let’s say the top 10% of the students will be selected for a more intensive program of study. The logical conclusion would be that this test has not let us accurately identify who the top 10% are, so we should look at some other criteria that is capable of producing a clearer differentiation among the top performers.
Frequently, instead of coming up with the score based on a percentile, we will need to come up with percentile based upon the score. To do this, we use the PERCENTRANK function.
In this example, we will use the same test scores from the previous example and for each test score we will calculate the corresponding percentile value. Even though there are 40 scores in our data set, the resultant table will only contain 25 scores as the duplicates are eliminated.
SELECT *
INTO #c
FROM (VALUES
(257),(261),(275),(283),(282),(261),(279),(256),
(263),(261),(283),(282),(249),(300),(257),(263),
(286),(261),(275),(245),(288),(267),(292),(255),
(279),(270),(300),(286),(285),(297),(278),(300),
(260),(269),(264),(273),(256),(300),(300),(290)
) n(x)
SELECT c1.x
,wct.PERCENTRANK(c2.x,c1.x,5) as PERCENTRANK
FROM #c c1, #c c2
GROUP BY c1.x
This produces the following result.
x PERCENTRANK
----------- ----------------------
245 0
249 0.02564
255 0.05128
256 0.07594
257 0.12658
260 0.17948
261 0.20125
263 0.30379
264 0.35897
267 0.38461
269 0.41025
270 0.43589
273 0.46153
275 0.48101
278 0.53846
279 0.55696
282 0.60759
283 0.65822
285 0.71794
286 0.73417
288 0.79487
290 0.82051
292 0.84615
297 0.87179
300 0.87939
We can see that a score of 300 corresponds to the 87.9 percentile; a score of 245 corresponds to the 0 percentile. We can see that the 50th percentile lies between 275 and 278 and that the 75th percentile lies between 286 and 288.
Let’s assume that the students have the opportunity to take the exam again, the teacher reviews the materials, and everybody retakes the exam.
SELECT *
INTO #c
FROM (VALUES
(248),(252),(258),(259),(259),(260),(260),(263),
(264),(264),(264),(264),(266),(266),(267),(270),
(272),(273),(276),(278),(278),(281),(282),(282),
(285),(285),(286),(286),(288),(289),(289),(291),
(293),(295),(300),(300),(300),(300),(300),(300)
) n(x)
SELECT c1.x
,wct.PERCENTRANK(c2.x,c1.x,5) as PERCENTRANK
FROM #c c1, #c c2
GROUP BY c1.x
DROP TABLE #c
This produces the following result.
x PERCENTRANK
----------- ----------------------
248 0
252 0.02564
258 0.05128
259 0.07594
260 0.12658
263 0.17948
264 0.20125
266 0.30379
267 0.35897
270 0.38461
272 0.41025
273 0.43589
276 0.46153
278 0.48101
281 0.53846
282 0.55696
285 0.60759
286 0.65822
288 0.71794
289 0.73417
291 0.79487
293 0.82051
295 0.84615
300 0.85355
We can see that there was no improvement in PERCENTRANK for any of their test scores and an actual decline in the percentile value for those with scores of 300. Let’s analyze this data a little further by assigning a test score to an id and keeping track of the scores for test 1 and test 2. We can then select the id, the test scores for test 1 and test 2, and the percentiles for test 1 and test 2.
SELECT *
INTO #d
FROM (VALUES
(15,1,245),(15,2,248),(9,1,249),(9,2,252),(10,1,255),(10,2,258),
(7,1,256),(7,2,259),(17,1,256),(17,2,259),(32,1,257),(32,2,260),
(33,1,257),(33,2,260),(31,1,260),(31,2,263),(26,1,261),(26,2,264),
(19,1,261),(19,2,264),(8,1,261),(8,2,264),(21,1,261),(21,2,264),
(22,1,263),(22,2,266),(6,1,263),(6,2,266),(14,1,264),(14,2,267),
(35,1,267),(35,2,270),(18,1,269),(18,2,272),(28,1,270),(28,2,273),
(4,1,273),(4,2,276),(20,1,275),(20,2,278),(25,1,275),(25,2,278),
(36,1,278),(36,2,281),(3,1,279),(3,2,282),(37,1,279),(37,2,282),
(13,1,282),(13,2,285),(23,1,282),(23,2,285),(29,1,283),(29,2,286),
(40,1,283),(40,2,286),(16,1,285),(16,2,288),(24,1,286),(24,2,289),
(39,1,286),(39,2,289),(1,1,288),(1,2,291),(38,1,290),(38,2,293),
(12,1,292),(12,2,295),(34,1,297),(34,2,300),(27,1,300),(27,2,300),
(11,1,300),(11,2,300),(2,1,300),(2,2,300),(5,1,300),(5,2,300),
(30,1,300),(30,2,300)
) n(id,tn,sc)
SELECT d1.id
,d1.sc as [Test 1 score]
,d3.sc as [Test 2 score]
,wct.PERCENTRANK(d2.sc, d1.sc, 5) [Test 1 PERCENTILE]
,wct.PERCENTRANK(d4.sc, d3.sc, 5) [Test 2 PERCENTILE]
FROM #d d1, #d d2, #d d3, #d d4
WHERE d1.tn = 1
AND d2.tn = 1
AND d3.tn = 2
AND d4.tn = 2
AND d3.id = d1.id
GROUP BY d1.id
,d1.sc
,d3.sc
This produces the following result.
id Test 1 score Test 2 score Test 1 PERCENTILE Test 2 PERCENTILE
----------- ------------ ------------ ---------------------- ----------------------
1 288 291 0.77548 0.77548
2 300 300 0.87554 0.85053
3 279 282 0.55034 0.55034
4 273 276 0.45028 0.45028
5 300 300 0.87554 0.85053
6 263 266 0.30018 0.30018
7 256 259 0.07504 0.07504
8 261 264 0.20012 0.20012
9 249 252 0.02501 0.02501
10 255 258 0.05003 0.05003
11 300 300 0.87554 0.85053
12 292 295 0.82551 0.82551
13 282 285 0.60037 0.60037
14 264 267 0.35021 0.35021
15 245 248 0 0
16 285 288 0.70043 0.70043
17 256 259 0.07504 0.07504
18 269 272 0.40025 0.40025
19 261 264 0.20012 0.20012
20 275 278 0.47529 0.47529
21 261 264 0.20012 0.20012
22 263 266 0.30018 0.30018
23 282 285 0.60037 0.60037
24 286 289 0.72545 0.72545
25 275 278 0.47529 0.47529
26 261 264 0.20012 0.20012
27 300 300 0.87554 0.85053
28 270 273 0.42526 0.42526
29 283 286 0.6504 0.6504
30 300 300 0.87554 0.85053
31 260 263 0.1751 0.1751
32 257 260 0.12507 0.12507
33 257 260 0.12507 0.12507
34 297 300 0.85053 0.85053
35 267 270 0.37523 0.37523
36 278 281 0.52532 0.52532
37 279 282 0.55034 0.55034
38 290 293 0.8005 0.8005
39 286 289 0.72545 0.72545
40 283 286 0.6504 0.6504
With just a slight adjustment to the SQL, we can get a little clearer picture of how the results changed.
SELECT p.id
,p.[Test 2 score] - p.[Test 1 score] as [Change in Score]
,p.[Test 2 PERCENTILE] - p.[Test 1 PERCENTILE] as [Change In Percentile]
FROM (
SELECT d1.id
,d1.sc as [Test 1 score]
,d3.sc as [Test 2 score]
,wct.PERCENTRANK(d2.sc, d1.sc, 5) [Test 1 PERCENTILE]
,wct.PERCENTRANK(d4.sc, d3.sc, 5) [Test 2 PERCENTILE]
FROM #d d1, #d d2, #d d3, #d d4
WHERE d1.tn = 1
AND d2.tn = 1
AND d3.tn = 2
AND d4.tn = 2
AND d3.id = d1.id
GROUP BY d1.id
,d1.sc
,d3.sc
) p
This produces the following result.
id Change in Score Change In Percentile
----------- --------------- ----------------------
1 3 0
2 0 -0.02501
3 3 0
4 3 0
5 0 -0.02501
6 3 0
7 3 0
8 3 0
9 3 0
10 3 0
11 0 -0.02501
12 3 0
13 3 0
14 3 0
15 3 0
16 3 0
17 3 0
18 3 0
19 3 0
20 3 0
21 3 0
22 3 0
23 3 0
24 3 0
25 3 0
26 3 0
27 0 -0.02501
28 3 0
29 3 0
30 0 -0.02501
31 3 0
32 3 0
33 3 0
34 3 0
35 3 0
36 3 0
37 3 0
38 3 0
39 3 0
40 3 0
It’s clear from this analysis, that everybody who did not have a perfect score on the first test improved their test score by 3 points and that everybody who got a perfect score on the first test got a perfect score on the second. However, none of the test-takers showed an improvement in percentile and the best-performing group, the group with perfect scores, actually showed a decline in percentile. Despite the fact that everybody’s performance improved, the top percentile went from 0.87554 to 0.85053. Thus, the statement that none of the test-takers scored above the 86th percentile on the second test as opposed to none scored above the 88th percentile in the first test would be literally true, but would convey the idea that overall performance had declined, when in fact it had improved.
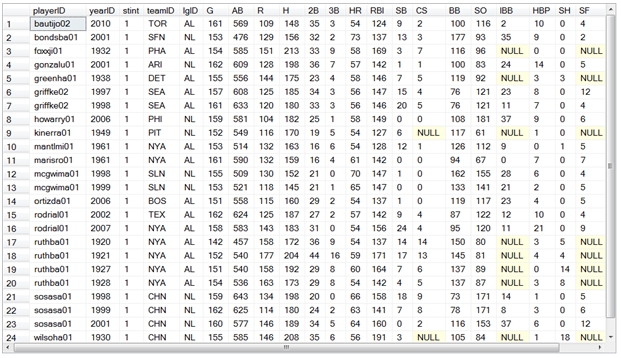
Let’s look at something a little more complicated. In this example, I use the baseball database from Sean Lahman’s site, http://baseball1.com/statistics/. In this database, he has a table of batting statistics which contains every player for every season for a total of 93,955 rows, which is a pretty small table for a database, but a massive amount of data for a spreadsheet.
Here’s the challenge. We want to calculate a PERCENTRANK for all the players who played in the 2010 season who had more than 199 at-bats (which is a relatively easy way to identify players who are everyday players). But, we want to calculate 4 different statistics all using players who had more than 199 at-bats. First, we want to calculate the percentile using the previous 3 years batting statistics for all MLB players. Second, we want to calculate the percentile using the 2010 statistics for all MLB players. Third, we want to calculate the percentile using the 2010 statistics for each league (AL or NL). Finally, we want to calculate the percentile for the team.
Here’s a picture of the batting table.
Our SQL will use a common table expression to calculate the 4 percentiles for each player, and then we will join to another table to get the player’s first name and last name to produce the report.
;with mycte as (
SELECT b1.playerID
,'3Y' as category
,b1.stint
,b1.H
,wct.PERCENTRANK(b2.H, b1.H, 3) Percentile
FROM BATTING b1, BATTING b2
WHERE b1.yearID = 2010
AND b1.AB > 199
AND b2.yearID > 2007
AND b2.AB > 199
GROUP by b1.playerID
,b1.stint
,b1.H
UNION ALL
SELECT b1.playerID
,'MLB' as category
,b1.stint
,b1.H
,wct.PERCENTRANK(b2.H, b1.H, 3) Percentile
FROM BATTING b1, BATTING b2
WHERE b1.yearID = 2010
AND b1.AB > 199
AND b2.yearID = b1.yearID
AND b2.AB > 199
GROUP by b1.playerID
,b1.stint
,b1.H
UNION ALL
SELECT b1.playerID
,b1.lgid
,b1.stint
,b1.H
,wct.PERCENTRANK(b2.H, b1.H, 3)
FROM BATTING b1, BATTING b2
WHERE b1.yearID = 2010
AND b1.AB > 199
AND b2.yearID = b1.yearID
AND b2.AB > 199
AND b2.lgid = b1.lgid
GROUP by b1.playerID
,b1.lgID
,b1.stint
,b1.H
UNION ALL
SELECT b1.playerID
,b1.teamID
,b1.stint
,b1.H
,wct.PERCENTRANK(b2.H, b1.H, 3)
FROM BATTING b1, BATTING b2
WHERE b1.yearID = 2010
AND b1.AB > 199
AND b2.yearID = b1.yearID
AND b2.AB > 199
AND b2.teamid = b1.teamid
GROUP by b1.playerID
,b1.teamID
,b1.stint
,b1.H
) SELECT master.nameLast + ', ' + master.nameFirst as Player
,m0.H
,m0.Percentile as [3Y Percentile]
,m1.Percentile as [MLB Percentile]
,m2.Percentile as [League Percentile]
,m3.Percentile as [Team Percentile]
FROM mycte m1, mycte m2, mycte m3, mycte m0, master
WHERE m0.playerID = master.playerID
AND m0.category = '3Y'
AND m1.playerID = m0.playerID
AND m1.stint = m0.stint
AND m1.category = 'MLB'
AND m2.playerID = m0.playerID
AND m2.stint = m0.stint
AND m2.category in('AL','NL')
AND m3.playerID = m0.playerID
AND m3.stint = m0.stint
AND m3.category not in('AL','NL','MLB','3Y')
ORDER BY 2 DESC, 1 ASC
Here are the first few rows of the resultant table.
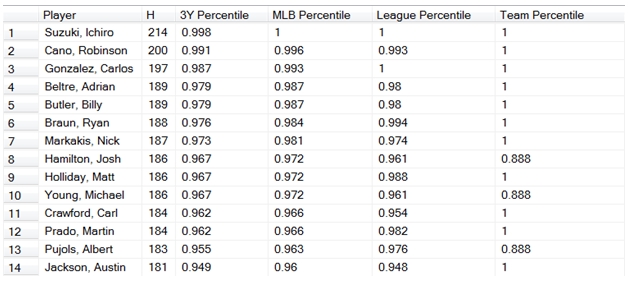
Ichiro Suzuki is number one on the list (no surprise there) with 214 hits, which is in the 99.8 percentile for the last three years, was in the 100th percentile for MLB in 2010, was in the 100th percentile for the American League, and was in the 100th percentile for his team, the Seattle Mariners. Michael Young was in 10th place, with 186 hits which is in the 96.7 percentile for the last three years, 97.2 percentile for all of MLB in 2010, 96.1 percentile for his league and 88.8 for his team. Since he and Josh Hamilton (8th on the list) play for the same team, they each have 88.8 as the team percentile as they tied for the team lead.
It is interesting to note, that the PERCENTRANK function does return a value of 1, meaning the 100th percentile. There are a lot of people that will argue that a percentile value of 1 (or 100) doesn’t make any sense. They might also argue that a percentile value of 0 doesn’t make any sense, either.
Here’s the way that I think about this. If I am doing an analysis of an entire population (in this case, all the MLB baseball players who had more than 199 at-bats in 2010), then it seems entirely reasonable that one player has achieved the maximum performance, and that performance could be assigned a value of 1, as it is greater than all other values. This is why neither Josh Hamilton, nor Michael Young gets a 1 for the team percentile statistic, as neither was greater than all the others in the team.
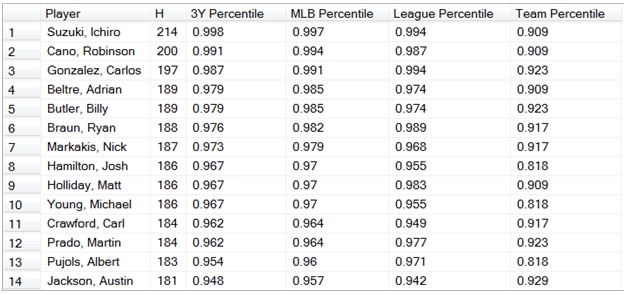
However, if we are calculating percentiles for a sample, then it seems unlikely that the sample would include either the maximum value or the minimum value. And if we want to make assessments about the population based on the sample, I think that it makes sense to assume that maximum value in the sample must be less than the 100th percentile and that the minimum value in the sample must be greater than the 0th percentile.
This is why, in addition to the PERCENTRANK function, there is also a PERCENTRANK_EXC function (which is the equivalent of the PERCENTRANK.EXC function in EXCEL). The PERCENTRANK_EXC function EXCludes the 0th and 100th percentile. If we change our SQL to use the PERCENTRANK_EXC function instead of the PERCENTRANK function, then our results look like this:
If we wanted to answer the question, how many hits would I have needed to be in the 95th percentile in 2010, then we can use the PERCENTILE function. Like the PERCENTRANK_EXC function, there is a PERCENTILE_EXC function, excluding the 0th and 100th percentile.
How does this differ from MATLAB? First, MATLAB does not have the equivalent of the PERCENTRANK function. If you want to calculate the percentile for a given score, you have to write your own MATLAB routine.
MATLAB also has its own implementation of PERCENTILE, which does not agree with either the PERCENTILE or the PERCENTILE_EXC functions. Here’s a very simple MATLAB example.
x=(1:5)
x =
1 2 3 4 5
y=prctile(x, [25, 50, 75])
y =
1.7500 3.0000 4.2500
Here’s what we get with the PERCENTILE and the PERCENTILE_EXC function.
SELECT m.p as PERCENTILE
,wct.PERCENTILE(k.x,m.p) as [SCORE (Include)]
,wct.PERCENTILE_EXC(k.x,m.p) as [SCORE (Exclude)]
FROM (VALUES (1),(2),(3),(4),(5)) k(x)
CROSS APPLY(VALUES (.25),(.50),(.75)) m(p)
GROUP BY m.p
ORDER BY 1
This produces the following results.
PERCENTILE SCORE (Include) SCORE (Exclude)
---------------------- ---------------------- ----------------------
0.25 2 1.5
0.50 3 3.0
0.75 4 4.5
As you can see, there is a significant difference. The MATLAB implementation is not supported in either EXCEL or in XLeratorDB.
In our SQL Server 2008 R2 test environment we have about 5.5 million rows of test data for the PERCENTRANK function. Our tests, which produce about 100,000 rows in the resultant table, run in about 11 seconds. Your performance may vary.
See Also