Calculating a Covariance Matrix in SQL Server
Apr
15
Written by:
Charles Flock
4/15/2014 4:58 PM

In this article we look at 2 relatively straightforward methods for calculating a variance-covariance matrix in SQL Server, using the XLeratorDB function library, and compare them to the calculation provided in the Excel Data Analysis tool.
We can think of a covariance matrix in the following way. Given the following 4-by-n data set
|
A1
|
B1
|
C1
|
D1
|
|
A2
|
B2
|
C2
|
D2
|
|
A3
|
B3
|
C3
|
D3
|
|
…
|
…
|
…
|
…
|
|
An
|
Bn
|
Cn
|
Dn
|
the covariance matrix would be a 4-by-4 matrix with the following elements:
|
cov(A,A)
|
cov(B,A)
|
cov(C,A)
|
cov(D,A)
|
|
cov(A,B)
|
cov(B,B)
|
cov(C,B)
|
cov(D,B)
|
|
cov(A,C)
|
cov(B,C)
|
cov(C,C)
|
cov(D,C)
|
|
cov(A,D)
|
cov(B,D)
|
cov(C,D)
|
cov(D,D)
|
where COV is the Covariance function and COV(A,B) would be the covariance of column A and column B. When the same column in passed into the covariance function twice, the result is the variance so the diagonal of the covariance matrix consists of the variance for each of the columns. This is why the covariance matrix is also known as the variance-covariance matrix.
|
var(A)
|
cov(B,A)
|
cov(C,A)
|
cov(D,A)
|
|
cov(A,B)
|
var(B)
|
cov(C,B)
|
cov(D,B)
|
|
cov(A,C)
|
cov(B,C)
|
var(C)
|
cov(D,C)
|
|
cov(A,D)
|
cov(B,D)
|
cov(C,D)
|
var(D)
|
The covariance matrix is a square (m-by-m) matrix where m is the number of columns in the dataset.
Let's look at an example where the data are not stored in third-normal form: what I usually refer to as spreadsheet format. We will just put some data into a table.
SELECT
*
INTO
#t
FROM (VALUES
(1,23,-16.7,14.2,-36.5,-35.6),
(2,6.4,7.5,-0.6,-31.5,-56.4),
(3,20.2,17.9,-4.2,41,-33.8),
(4,20.8,31.3,-7.2,10,23.4),
(5,-0.4,8.9,43.2,35.5,27.6),
(6,6.6,-12.7,21,36.5,-2),
(7,-7.6,-24,32.8,8.5,54.8),
(8,6.2,9.2,15,-19,-51),
(9,8,-5.7,24,37.5,36.8),
(10,2.8,-16.3,7.4,18,-41.8)
)N(rn,A,B,C,D,E)
SELECT
*
FROM
#t
This is what the table should look like.
|
rn
|
A
|
B
|
C
|
D
|
E
|
|
1
|
23
|
-16.7
|
14.2
|
-36.5
|
-35.6
|
|
2
|
6.4
|
7.5
|
-0.6
|
-31.5
|
-56.4
|
|
3
|
20.2
|
17.9
|
-4.2
|
41
|
-33.8
|
|
4
|
20.8
|
31.3
|
-7.2
|
10
|
23.4
|
|
5
|
-0.4
|
8.9
|
43.2
|
35.5
|
27.6
|
|
6
|
6.6
|
-12.7
|
21
|
36.5
|
-2
|
|
7
|
-7.6
|
-24
|
32.8
|
8.5
|
54.8
|
|
8
|
6.2
|
9.2
|
15
|
-19
|
-51
|
|
9
|
8
|
-5.7
|
24
|
37.5
|
36.8
|
|
10
|
2.8
|
-16.3
|
7.4
|
18
|
-41.8
|
The covariance matrix is calculated on all the possible 2-column combinations. Order matters, so there are 5 * 5 possible column combinations. One way to approach the calculation is just construct 25 explicit pieces of SQL to do the calculation; something like this.
SELECT
'A' as row,
'A' as col,
wct.COVARIANCE_P(A,A) as COVAR
FROM
#t
UNION ALL
SELECT
'A' as row,
'B' as col,
wct.COVARIANCE_P(A,B) as COVAR
FROM
#t
UNION ALL
SELECT
'A' as row,
'C' as col,
wct.COVARIANCE_P(A,C) as COVAR
FROM
#t
--Keep repeating until all possible
--combinations have been entered, ending
--with E E.
UNION ALL
SELECT
'E' as row,
'E' as col,
wct.COVARIANCE_P(E,E) as COVAR
FROM
#t
But there is a much more efficient and simpler way to do this. We can UNPIVOT the columns using the CROSS APPLY syntax and automatically generate all the possible column combinations.
SELECT
x.col as row,
y.col,
WCT.COVARIANCE_P(x.val,y.val) as COVAR
FROM
#t
CROSS APPLY(VALUES
('A',A),('B',B),('C',C),('D',D),('E',E))x(col,val)
CROSS APPLY(VALUES
('A',A),('B',B),('C',C),('D',D),('E',E))y(col,val)
GROUP BY
x.col,
y.col
This produces the following result.
row col COVAR
---- ---- ----------------------
A A 88.28
B A 74.25
C A -98.624
D A -47.02
E A -128.456
A B 74.25
B B 283.4524
C B -132.2284
D B 39.265
E B -74.754
A C -98.624
B C -132.2284
C C 239.0384
D C 112.75
E C 339.412
A D -47.02
B D 39.265
C D 112.75
D D 786.15
E D 567.34
A E -128.456
B E -74.754
C E 339.412
D E 567.34
E E 1500.12
If you wanted to return the result in 'spreadsheet' format, we can simply wrap our SQL inside a PIVOT statement.
SELECT
[A],[B],[C],[D],[E]
FROM (
SELECT
x.col as row,
y.col,
WCT.COVARIANCE_P(x.val,y.val) as COVAR
FROM
#t
CROSS APPLY(VALUES
('A',A),('B',B),('C',C),('D',D),('E',E))x(col,val)
CROSS APPLY(VALUES
('A',A),('B',B),('C',C),('D',D),('E',E))y(col,val)
GROUP BY
x.col,
y.col
) D
PIVOT(
SUM(COVAR)
FOR
col in([A],[B],[C],[D],[E])
) as P
ORDER BY
row
This produces the following result.
|
A
|
B
|
C
|
D
|
E
|
|
88.28
|
74.25
|
-98.624
|
-47.02
|
-128.456
|
|
74.25
|
283.4524
|
-132.228
|
39.265
|
-74.754
|
|
-98.624
|
-132.228
|
239.0384
|
112.75
|
339.412
|
|
-47.02
|
39.265
|
112.75
|
786.15
|
567.34
|
|
-128.456
|
-74.754
|
339.412
|
567.34
|
1500.12
|
It turns out that Excel has a Data Analysis tool for calculating the covariance matrix. Let's see what it returns using the same data.
|
|
A
|
B
|
C
|
D
|
E
|
|
A
|
88.28
|
|
|
|
|
|
B
|
74.25
|
283.4524
|
|
|
|
|
C
|
-98.624
|
-132.228
|
239.0384
|
|
|
|
D
|
-47.02
|
39.265
|
112.75
|
786.15
|
|
|
E
|
-128.456
|
-74.754
|
339.412
|
567.34
|
1500.12
|
Interestingly, Excel only returns the lower triangular portion of the covariance matrix. As you can see from the matrix we created in SQL Server, the covariance matrix is symmetric so that the value for cov(A,B) = cov(B,A). There is really no explanation in the Excel documentation about why the upper triangular portion of the matrix is not returned.
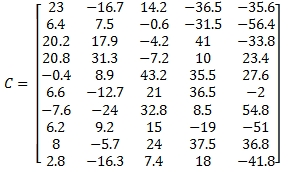
In dealing with the data in spreadsheet format, our SQL is sensitive to the column definition of the underlying table. In this next example we will use some matrix functions from the XLeratorDB/math library to create the covariance matrix, which returns a result in third-normal form, and which doesn't require un-pivoting the underlying data.
DECLARE @C as varchar(max) = wct.MATRIX2STRING_q(
'SELECT
*
FROM (VALUES
(23,-16.7,14.2,-36.5,-35.6),
(6.4,7.5,-0.6,-31.5,-56.4),
(20.2,17.9,-4.2,41,-33.8),
(20.8,31.3,-7.2,10,23.4),
(-0.4,8.9,43.2,35.5,27.6),
(6.6,-12.7,21,36.5,-2),
(-7.6,-24,32.8,8.5,54.8),
(6.2,9.2,15,-19,-51),
(8,-5.7,24,37.5,36.8),
(2.8,-16.3,7.4,18,-41.8)
)N(A,B,C,D,E)'
)
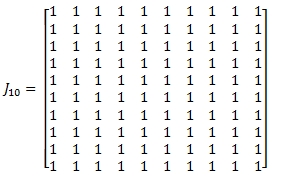
DECLARE @mrows as float = wct.MROWS(@C)
DECLARE @invmrows as float = 1e+00/@mrows
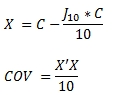
DECLARE @x as varchar(max) = wct.MATSUB(@C, wct.MATMULT(wct.MATMULT(wct.ONES(@mrows,@mrows),@C),@invmrows))
SELECT
*
FROM
wct.MATRIX(wct.MATMULT(wct.MATMULT(wct.TRANSPOSE(@x),@x),@invmrows))
This produces the following result.
RowNum ColNum ItemValue
----------- ----------- ----------------------
0 0 88.28
0 1 74.25
0 2 -98.624
0 3 -47.02
0 4 -128.456
1 0 74.25
1 1 283.4524
1 2 -132.2284
1 3 39.265
1 4 -74.754
2 0 -98.624
2 1 -132.2284
2 2 239.0384
2 3 112.75
2 4 339.412
3 0 -47.02
3 1 39.265
3 2 112.75
3 3 786.15
3 4 567.34
4 0 -128.456
4 1 -74.754
4 2 339.412
4 3 567.34
4 4 1500.12
This SQL used the following formula to calculate the covariance matrix.
As with the COVARIANCE_P function, if you want the resultant table returned in spreadsheet format you will have to use a PIVOT.
SELECT
[0],[1],[2],[3],[4]
FROM (
SELECT
*
FROM
wct.MATRIX(wct.MATMULT(wct.MATMULT(wct.TRANSPOSE(@x),@x),@invmrows))
) D
PIVOT(
SUM(ItemValue)
FOR
ColNum in([0],[1],[2],[3],[4])
) as P
ORDER BY
RowNum
The following SQL will automatically figure out the number of columns and return the results in spreadsheet format, so that it can be used regardless of the dimension of the input matrix.
DECLARE @C as varchar(max) = wct.MATRIX2STRING_q(
'SELECT
*
FROM (VALUES
(47.5,18.7,9.2,8.9),
(33.6,-16.3,11.5,10.3),
(33.4,-4,26.5,-3.5),
(-7.6,26.3,-4.3,14),
(-17.6,12.3,-15.7,7.5),
(-24.4,3.7,14.1,14.1),
(30.8,35.6,41.8,2.3),
(15.1,30.7,23.6,3.4),
(15.9,11.8,10.8,2.3),
(7.5,35,25.9,3.1)
)n(a,b,c,d)'
)
DECLARE @mrows as float = wct.MROWS(@C)
DECLARE @mcols as float = wct.MCOLS(@C)
DECLARE @invmrows as float = 1e+00/@mrows
DECLARE @x as varchar(max) = wct.MATSUB(@C, wct.MATMULT(wct.MATMULT(wct.ONES(@mrows,@mrows),@C),@invmrows))
DECLARE @sqlstring as varchar(max) = '
SELECT
@cols
FROM (
SELECT
*
FROM
wct.MATRIX(wct.MATMULT(wct.MATMULT(wct.TRANSPOSE(' + wct.QUOTES(@x) + '),' + wct.QUOTES(@x) + '),' + cast(@invmrows as varchar(max)) + '))
) D
PIVOT (
SUM(ItemValue)
FOR
ColNum in (@cols)
) as P
ORDER BY
RowNum'
DECLARE @columns as varchar(max) =(
SELECT
'[' + CAST(SeriesValue as varchar(max)) + ']'
FROM
wct.SeriesInt(0, @mcols-1,NULL,NULL,NULL)
ORDER BY
SeriesValue
FOR XML PATH('')
)
SET @columns = REPLACE(@columns, '][','],[')
SET @sqlstring = REPLACE(@sqlstring,'@cols',@columns)
EXEC(@sqlstring)
This produces the following result.
|
0
|
1
|
2
|
3
|
|
514.8396
|
-35.3496
|
175.8802
|
-58.5918
|
|
-35.3496
|
269.6696
|
66.5608
|
-11.2652
|
|
175.8802
|
66.5608
|
241.8224
|
-48.4866
|
|
-58.5918
|
-11.2652
|
-48.4866
|
29.0984
|
All of the examples in this article were entered in SQL Server 2012. XLeratorDB works in SQL Server 2005, 2008, 2012, and 2014, though some functions might have a different syntax in SQL Server 2005.
You should download the 15-day free trial today and see how you can use XLeratorDB to get the most out of the data in your database engine.