Underdetermined Systems and Ordinary Least Squares
Apr
14
Written by:
Charles Flock
4/14/2019 9:47 AM

Multiple Linear Regression (aka Ordinary Least Squares) usually calculates the best fit for a series of independent x-value and dependent y-values. Most of these linear systems have more rows than columns which will generate a unique solution. Those systems are called overdetermined systems. In this article, we look at underdetermined systems (where the number of rows is less than the number columns) and compare how they are handled in XLeratorDB, Excel, Google Sheets, and R. You will be surprised at what we discovered.
A few weeks ago a client contacted us about the XLeratorDB LINEST function and whether or not it could a handle a linear system where the number of rows was less than the number of columns. I told him that in such a case the LINEST function would generate an error message because it requires that the number of rows to at least be equal to the number of regressors.
He then told me that he could do it in Excel, so I asked him to send me his workbook, which he did. After reviewing his workbook I discovered that his particular example wasn’t actually doing what he thought it was doing and that he actually did have a linear system that satisfied the requirements with regards to the number of rows and the number of regressors. Further, XLeratorDB and Excel produced identical results.
A few days later he came back to me and told me that he was able to get Excel to produce values in LINEST where the number of rows was less than the number of regressors. I really had a hard time believing this and because of the difference in time zones and language I started investigating on my own.
I use Google Sheets a lot more than I use Excel these days. I created a Sheet with 4 regressors plus the intercept but with only three rows of data:
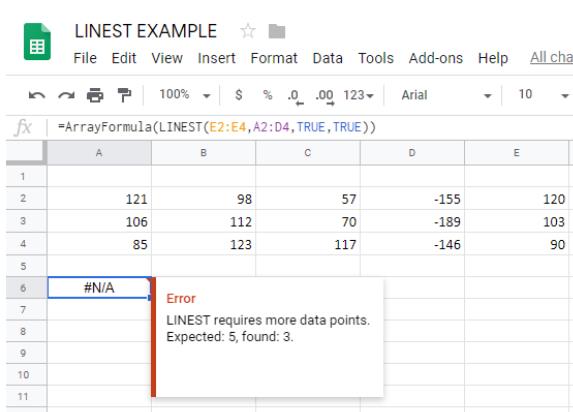
This produced the expected error message.
I then tried the same thing in R using Jupyter Notebooks.
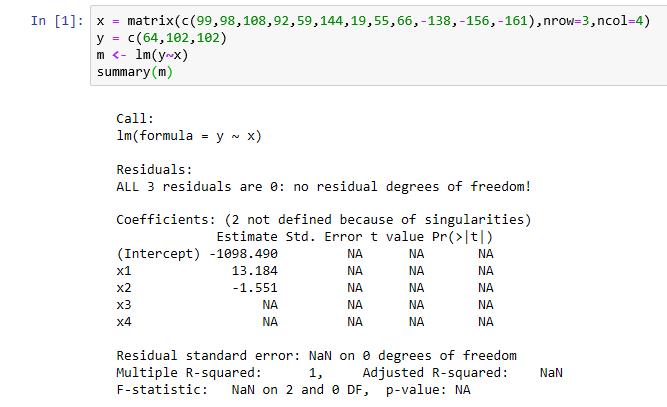
I was actually a little surprised by this, as I expected R not to return a result at all. However, there is a warning message in the summary results for the coefficients: "2 not defined because of singularities".
I then zeroed in on the Multiple R-squared of 1. This means that the fitted y-values were exactly the same as the supplied y-values; there was no residual error. In effect, the x3 and x4 columns were dropped in regression and the number of rows was equal to the number of regressors, providing an exact fit for this linear system.
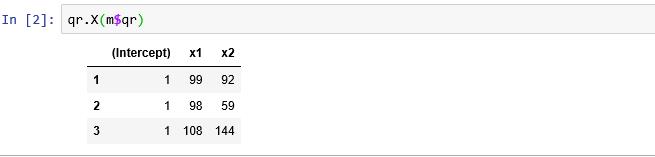
This is easy enough to check in R, as the QR decomposition is stored as part of the regression and we can use that to reconstruct the x matrix, including the intercept.
Given the R results I put the same data into Excel and ran LINEST.
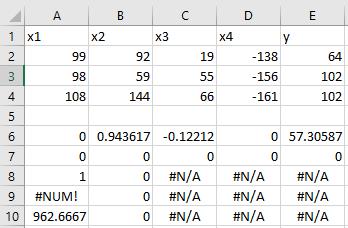
Unlike Google Sheets, Excel actually returns coefficients but not the same coefficients as R. But, like R, the R-squared is 1, the degrees of freedom is 0, the sum-of-squares residual is 0 and the F-statistic is 0. Interestingly, Excel returns the standard error of the coefficients as 0 whereas R returns them as NA.
Here’s the result from the Regression Data Analysis tool from the Excel Analysis Tool Pack.
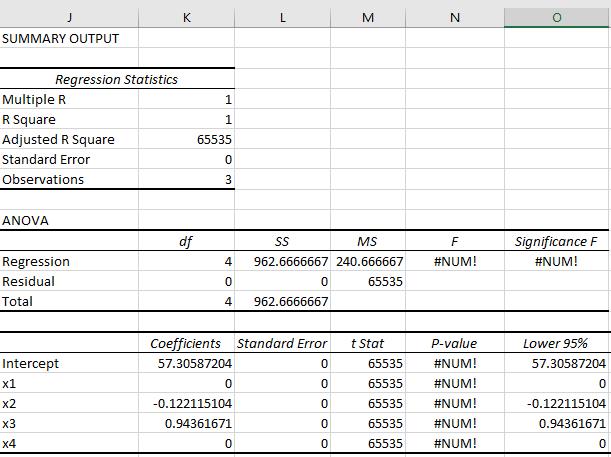
These results are all manifestations of what is known as an underdetermined system. Most of the time, ordinary least squares problems are overdetermined; i.e. there are more rows than regressors. One of the attributes of an overdetermined system is that there is a single solution. In other words, there is only one set of coefficients that best fits the data.
That is not the case with underdetermined systems. With underdetermined systems there are multiple solutions. This is actually quite easy to demonstrate with XLeratorDB. The following SQL will product produce all the combinations
SELECT
*
INTO
#t
FROM (VALUES
(99,92,19,-138,64)
,(98,59,55,-156,102)
,(108,144,66,-161,102)
)n(x1,x2,x3,x4,y)
SELECT
ISNULL(Intercept, 0) as Intercept
,ISNULL(x1,0) as x1
,ISNULL(x2,0) as x2
,ISNULL(x3,0) as x3
,ISNULL(x4,0) as x4
FROM (
SELECT
n.regressors,
L.stat_val,
L.stat_name,
L.col_name
FROM (VALUES
('x1,x2'),
('x1,x3'),
('x1,x4'),
('x2,x3'),
('x2,x4'),
('x3,x4')
)n(regressors)
CROSS APPLY
wct.LINEST('#t',CONCAT(n.regressors,',y'),'',NULL,3,'1')L
WHERE
stat_name = 'm'
)d
PIVOT (max(stat_val) for col_name in (Intercept,x1,x2,x3,x4))pvt
ORDER BY
regressors
The resultant table show all the possible combination of coefficients and regressors, each of which provides an exact fit, meaning the R-squared is 1, the residual degrees of freedom is 0, the sum-of squares residual is zero, etc.
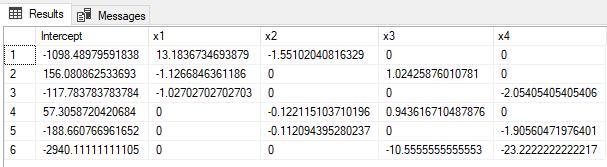
Notice that row 1 has returned the same results as R. Row 4 has returned the same results as Excel. But there are 4 other results that are exactly as good a fit, depending on which columns are used in the regression.
We can run the following SQL to look at some of the summary statistics from the 6 different regressions.
SELECT
pvt.regressors
,pvt.rsq
,pvt.ss_resid
,pvt.ss_reg
,pvt.df
,pvt.F
FROM (
SELECT
n.regressors
,L.stat_val
,L.stat_name
FROM (VALUES
('x1,x2'),
('x1,x3'),
('x1,x4'),
('x2,x3'),
('x2,x4'),
('x3,x4')
)n(regressors)
CROSS APPLY
wct.LINEST('#t',CONCAT(n.regressors,',y'),'',NULL,3,'1')L
)d
PIVOT (MAX(stat_val) FOR stat_name in (rsq, ss_resid, ss_reg, df, F))pvt
ORDER BY
1
You can see from the resultant table that the regression statistics are the same for each of the combinations, at least within the limits of floating-point arithmetic.
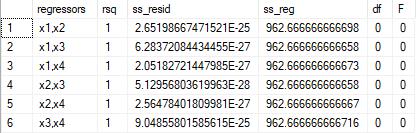
As a practical matter what does this all mean?
First, if you are using ordinary least squares to make predictions you should not use underdetermined system; their predictive value will be extremely low. And you might not realize that you are doing so, as the TREND and GROWTH functions perform Ordinary Least Squares under the covers and you might not realize how poor those predicted values might be.
Second, if you are using ordinary least squares to explain the linear system, the explanation won’t make much sense. In our example, there are 6 possible values for the intercept and 3 possible values for each of the regressors (x1, x2, x3, x4). There’s not much explanatory value in that.
That’s why we think that the best solution is the Google Sheets solution; explicitly trap the problem and report the error. GIGO (Garbage In, Garbage Out) is an acronym for a reason.
Let us know what you think! Send an e-mail so support@westclintech.com. If you want to try doing linear regression in SQL Server download the 15-day Trial and try some of the examples in this article or in the documentation on the website.