What’s new in XLeratorDB/statistics 2008 v1.08
Mar
7
Written by:
Charles Flock
3/7/2011 10:10 PM

A look at the 32 new aggregate functions in XLeratorDB/statistics2008 v1.08.
A few months ago, we released XLeratorDB/statistics2008 which included 16 functions that had been converted from scalar functions to aggregates to take advantage of the multi-input aggregate function architecture available in SQL Server 2008. Those new aggregate functions perform up to 50 times faster than their scalar equivalents and are much easier to use. Those functions all had one thing in common; they were single-pass solutions. Basically this means that there was no reason to store the data for subsequent calculation. All the calculations requiring the data are done as the data are received into the function.
With the new release of XLeratorDB/statistics2008, we have taken the next logical step: creating functions that require two passes of the data. This means that the data are retained in the function and once all the data have been captured, the calculation can be performed. A simple example of this is the MEDIAN function. It is not possible to calculate the MEDIAN of a dataset until you know the number of items in the dataset and the data are sorted. In an aggregate function there is no way to force or guarantee the order of the data. Thus, the calculation is done once all the data are collected.
In our testing, the new aggregates performed, on average, about 10 times faster than the equivalent scalar implementations, but that will vary by machine. We also found that the more complex the SQL, the greater the performance improvement. We also think that implementing these functions as aggregates makes the SQL simpler and more intuitive.
We have converted twenty-five scalar functions to be multi-input aggregates and added seven new functions. The new aggregate functions that were converted from scalars are:
If you want to continue to use scalar versions of the functions, simply use the function name with ‘_q’ added at the end. For example, the scalar implementation of PERCENTILE, PERCENTILE_q, is still part of the package.
We also added four new functions to maintain parity with EXCEL 2010.
We also added three new functions to calculate the range of a dataset, the inter-quartile range, and the range between any two percentiles.
As always, you can find out more about each function by going to the documentation.
Let’s look at the PERCENTILE function to see what the change from scalar to aggregate means for SQL Server 2008 users. For purposes of this example, I am using a database of baseball statistics. The table that we are interested in has the following definition:
The first thing that we will calculate is the 95th percentile for home runs (HR) in a season. We are only interested in those batters who have had 200 or more at-bats (AB) and we are only interested in years (yearID) subsequent to 1920. The SQL looks like this:
SELECT yearID
,wct.PERCENTILE(HR,.95) as HR --95th percentile
FROM Batting
WHERE AB > 199 --200 or more at-bats
AND yearID > 1920 --1921 to 2010
GROUP BY yearID
ORDER BY 1 DESC
Here are the first few rows returned by the SQL.
To do the same thing with the scalar implementation, using the PERCENTILE_q function, we would enter the following SQL.
SELECT b.yearid
,wct.PERCENTILE_q(
'SELECT HR
FROM batting
WHERE AB > 199
AND yearid = ' + cast(b.yearid as varchar)
,.95) as HR
FROM batting b
WHERE b.yearid > 1920
GROUP BY b.yearid
ORDER BY 1 DESC
This produces the same results as the aggregate, but the SQL is more complicated. In SQL Server 2005, the PERCENTILE function remains a scalar function. It it designed for simpler statements (PERCENTILE_q, above, allows for far greater flexibility), and to use it in this case requires staging of the data into a temporary table. In SQL Server 2005, we would enter something like this.
SELECT yearid, HR
INTO #b
FROM Batting
WHERE AB > 199
AND YEARID > 1920
SELECT #b.yearid
,wct.PERCENTILE('#b','HR','yearid',#b.yearid, .95)
from #b
GROUP BY #b.yearid
order by 1 DESC
DROP TABLE #b
This, also, produces the same results as the aggregate.
SQL Server 2005 users may be aware of the fact that we have taken some of our multi-input aggregates and implemented them as single input aggregates in SQL Server 2005, by concatenating values together. For example, the SLOPE function in SQL Server 2005 takes fmtSLOPE(y, x) as input, where is fmtSLOPE is a string with the concatenated y- and x-values.
We were able to do that for functions like SLOPE, because they have single-pass implementations. PERCENTILE and the 24 other functions that are included as aggregates in this release, do not. As a result, we will be continuing to maintain their scalar implementations in SQL Server 2005.
Aggregates in SQL Server 2005 have a MaxByteSize of 8000 which means that the aggregate functions can store up to 8000 bytes of data. For some functions this might be OK, but for functions like PERCENTILE or MEDIAN, this seems to be too little data.
SQL Server 2005 users will continue to have the scalar PERCENTILE and PERCENTILE_q functions available in XLeratorDB/statistics.
Let’s get back to the PERCENTILE aggregate. Now that we see how easy it is to use, let’s look at a few more examples.
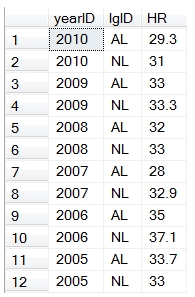
We now realize that in our example that we want to split out the National League and the American League. We can simply add another column to our SQL.
SELECT yearID
,lgID
,wct.PERCENTILE(HR,.95) as HR --95th percentile
FROM Batting
WHERE AB > 199 --200 or more at-bats
AND yearID > 1920 --1921 to 2010
GROUP BY yearID, lgID
ORDER BY 1 DESC
Here are the first few rows returned by the SQL.
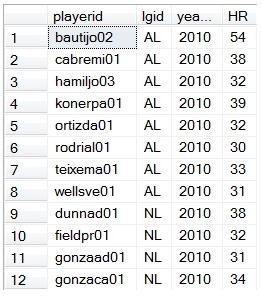
Let’s add the names of the players who were in the 95th percentile of above. Using the aggregate function, it’s simple to add a few more columns and then use a GROUP BY on the resultant table.
SELECT B.playerid
,b.lgid
,B.yearid
,B.HR
FROM (
SELECT yearID
,lgID
,wct.PERCENTILE(HR,.95) as HR
FROM Batting
WHERE AB > 199
AND yearID > 1920
GROUP BY yearID, lgID
) N, BATTING B
WHERE B.yearID = N.yearID
AND B.lgID = N.lgID
AND B.HR >= N.HR
ORDER BY 3 desc, 2 asc, 1 ASC
Here are the first few rows returned by preceding statement.
Finally, let’s see which players have been at the 95th percentile or higher for home runs the most number of times. We will join to a table called to Master to get the first and last names of those players.
SELECT master.nameLast + ', ' + master.nameFirst as Player
,COUNT(*) as [Number of Seasons]
FROM (
SELECT B.playerid
,b.lgid
,B.yearid
,B.HR
FROM (
SELECT yearID
,lgID
,wct.PERCENTILE(HR,.95) as HR
FROM Batting
WHERE AB > 199
AND yearID > 1920
GROUP BY yearID, lgID
) N, BATTING B
WHERE B.yearID = N.yearID
AND B.lgID = N.lgID
AND B.HR >= N.HR
) m, MASTER
WHERE m.playerID = Master.playerID
GROUP BY master.nameLast, master.nameFirst
ORDER BY 2 DESC
Here are the first few rows returned from this SQL.
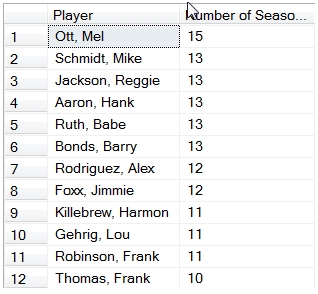
On my 32-bit laptop, with 94,000 rows in the Batting table, this last piece of SQL returned 368 rows and ran in less than a second. Could you even do something like this in EXCEL? I certainly wouldn’t know how.
We think that the new aggregate functions in XLeratorDB/statistics2008 are a major improvement over the previous scalar versions. They are more powerful, easier to use, and more intuitive. Let us know what you think.