An Historic Trough
Oct
15
Written by:
Charles Flock
10/15/2009 6:19 PM

A quick look at some business intelligence that you won’t get on most dashboards.
I started out writing a different article. I intended to do one of my usual articles about how to do stuff in XLeratorDB and to show how this was much easier than doing it with EXCEL. My focus was particularly on analyzing equity market returns, mainly because there are many data points.
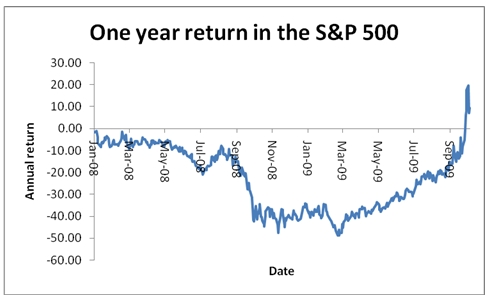
In doing this analysis, one of the many things that I was analyzing was returns over a one-year time horizon. I looked at what the return would be if I bought the index, held on to it for exactly one year, and then sold it. If the one-year date was a non-business day, I assumed that the sale was on the next business day. The source data for the index prices came from Yahoo.
I was surprised to discover that on 10/07/2009, the one-year return for the S&P 500 was positive. In other words, if you had bought the S&P 500 at the closing price on 10/7/2008 and then sold it at the closing price on 10/7/2009 you would have made 6.16% (excluding commissions, fees, and all that stuff). The S&P 500 adjusted close on 10/7/2008 was 996.23 and on 10/7/2009, it was 1,057.58. According to my calculations, the last time that was true was on 1/10/2008 when the one-year return was 0.39%, assuming that you bought the index on 1/10/2007 for 1,414.85 and sold it on 1/10/2008 for 1,420.33. That is a streak of 438 trading days, 21 months, where the one-year return was negative, the longest such streak in S&P 500 since its inception in 1950.