Comparing the Excel XIRR function to Google and XLeratorDB
Apr
10
Written by:
Charles Flock
4/10/2015 12:42 PM

XIRR is one of XLeratorDB's most popular financial functions. At Westclintech, we get more inquiries about XIRR than all of the other 200+ financial functions combined. To create a reliable version of XIRR for SQL Server we had to create, quite literally, millions of different test cases which were then tested against Excel.
One technique for creating test cases was to generate all the cash flows except the first one, then make the first cash flow equal and opposite in sign to the discounted cash flow value, or net present value, of all the other cash flows at some discount rate and check to if the internal rate of return, as calculated by the Excel XIRR function, is equal to the discount rate.
Mathematically that technique is absolutely sound, yet we discovered that Excel was not at all reliable in producing the expected result. In this article we share with you what we found.
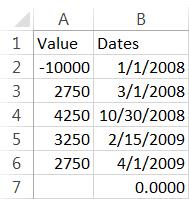
XIRR calculates a value for discount rate such that the net present value of the cash flows is approximately equal to zero. Using the example from the Excel documentation demonstrates that pretty clearly:
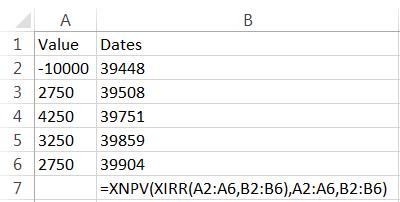
This spreadsheet should look like this:
What is not necessarily evident, however, is that the discount rate returned by XIRR can also be used to calculate the initial cash flow.
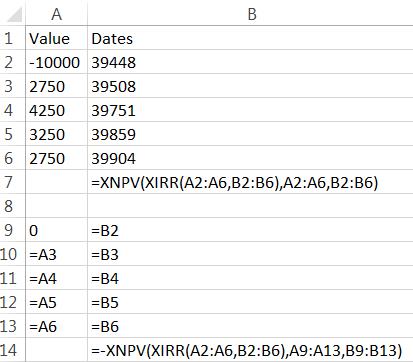
This spreadsheet should look like this:
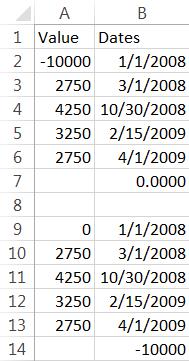
Using this technique, set up an Excel spreadsheet with the following data and formulas.
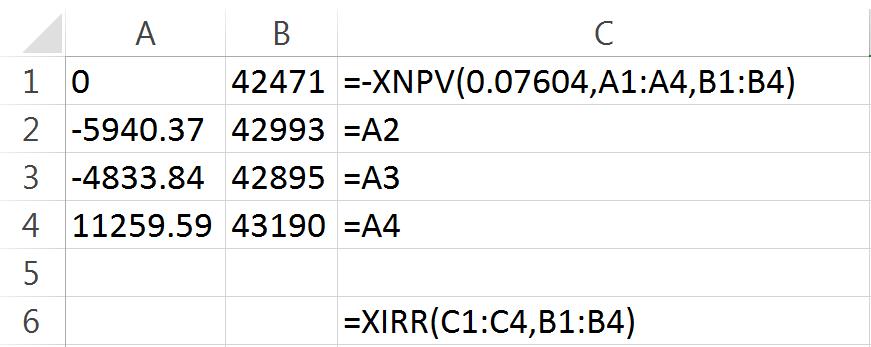
In column A we have entered 4 cash flows. In column B we have entered the dates associated with these cash flows. In C1 we have entered a formula which calculates the net present value of the cash flows in A2:A4 using a discount rate of 0.07604 and using the dates in B2:B4. The XNPV function is preceded by a minus sign so we are actually calculating the net present value multiplied by -1. This should force the internal rate of return to be equal to the discount rate. We enter the XIRR function in C6 using the cash flows in C1:C4 and the dates in B1:B4.
This is what the spreadsheet should look like.
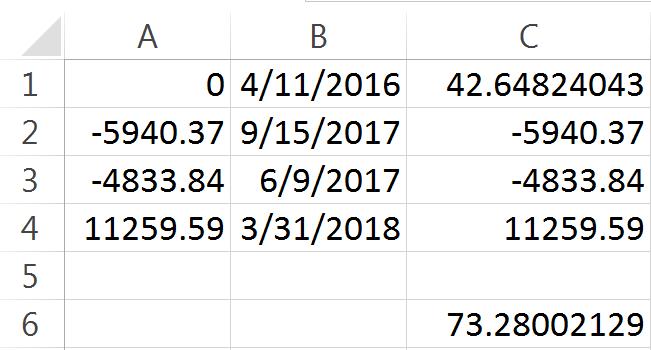
Look at the value in C6; 73.28002129—not the 0.07604 that we expect.
You can use Google sheets to check these calculations. Just open a Google sheet and enter exactly the same data and formula as were entered in Excel.
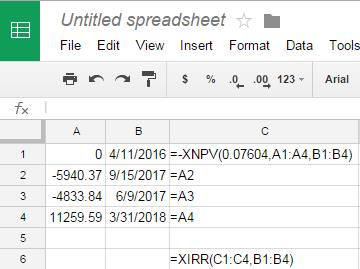
Which gives us the following result.
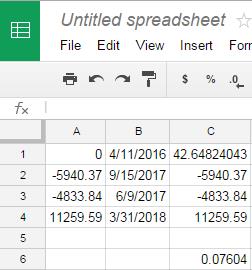
As you can see, the Google sheet, as expected, returns the discount rate that was used to create the cash flow. What's going on with the Excel calculation?
One of the Excel (and Google) parameters to the XIRR function is something called guess. The guess is actually quite an important value in the function, as it is the point from where the function starts searching for a solution for discount rate such that the XNPV of the cash flows is approximately zero. Let's try some different values for guess in Excel.
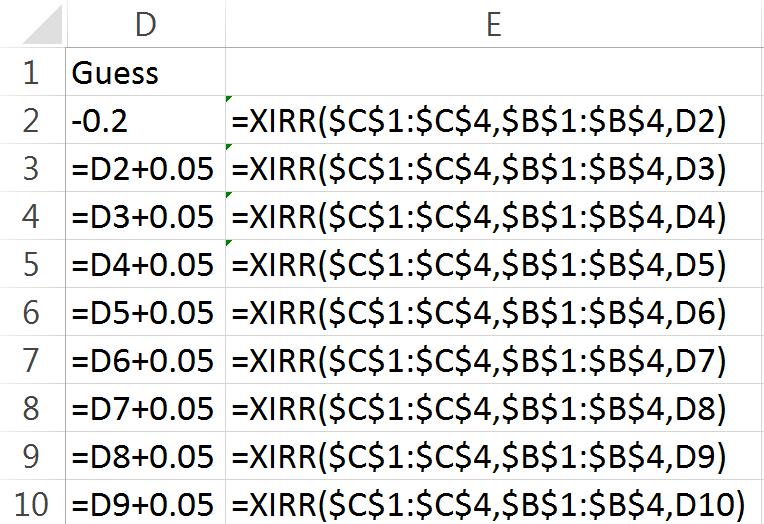
Our spreadsheet now looks like this:
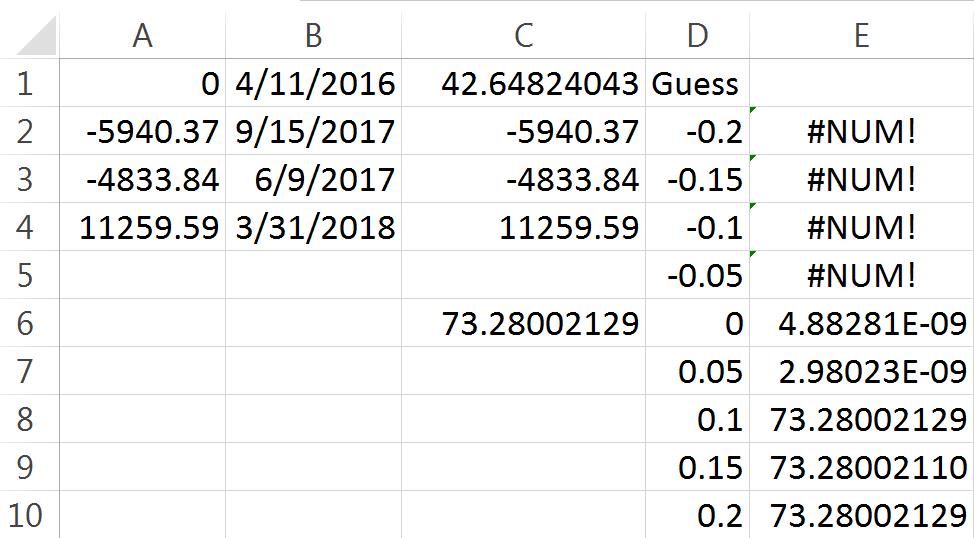
There are nine guesses equally spaced from -0.20 to 0.20. For all the negative guesses, the XIRR function returned #NUM! which means that Excel could not find a solution. For guesses of 0.00 and 0.05 Excel returned a solution that is approximately zero (2.98023E-09 = 0.00000000298023). Excel’s answer is clearly wrong, as the sum of the discounted cash flows when the discount rate is zero (or this close to zero) is just the sum of the cash flows.
Let's see what happens when we use the discount rate that we started with as the guess. Remember, this value was used to create the cash flow that zero-izes all the other cash flows. In C8 enter the following formula: =XIRR($C$1:$C$4,$B$1:$B$4,0.07604). Here's what the spreadsheet looks like.
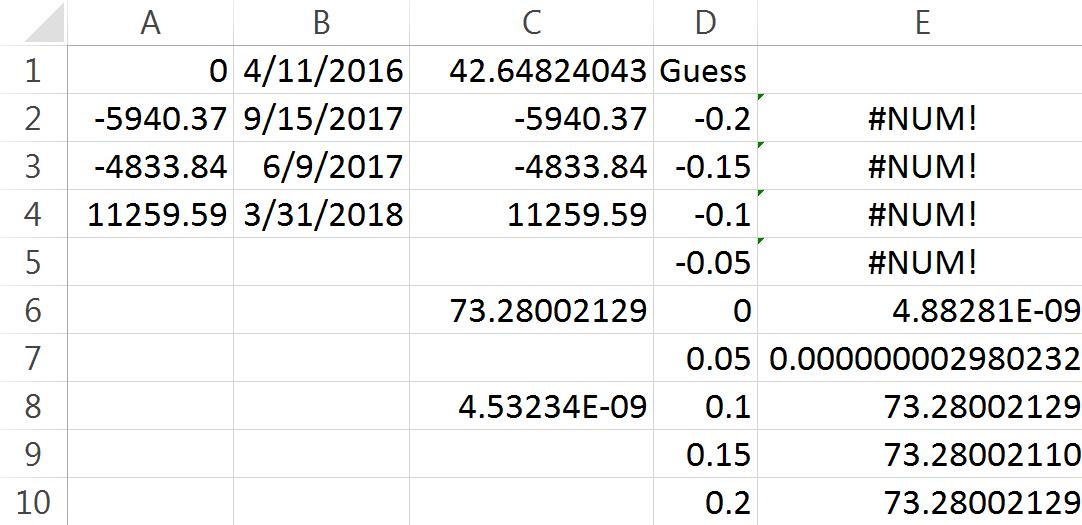
Again, Excel produces what we have taken to calling a false zero. This is actually quite remarkable, because under no condition is Excel able to recover the discount rate that was used to create this test case. It is just completely lost, like information that has been trapped in a black hole.
Let's see what Google returns for the range of guesses.
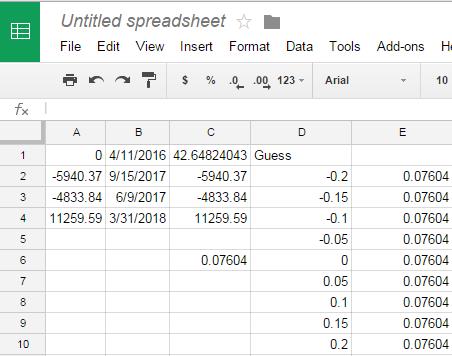
Google always returns the value used to create this test case.
Let's see what XLeratorDB returns in SQL Server 2012 using the same technique.
DECLARE @CF as TABLE (
amt_cf float,
date_cf datetime
)
INSERT INTO @CF VALUES (0,'2016-04-11')
INSERT INTO @CF VALUES (-5940.37,'2017-09-15')
INSERT INTO @CF VALUES (-4833.84,'2017-06-09')
INSERT INTO @CF VALUES (11259.59,'2018-03-31')
SELECT
x.guess,
ROUND(wct.XIRR(amt_cf,date_cf,x.guess),9) as XIRR
FROM (
SELECT
-wct.XNPV(.07604,amt_cf,date_cf) as amt_cf,
MIN(date_cf) as date_cf
FROM
@CF
UNION ALL
SELECT
amt_cf,
date_cf
FROM
@CF
)p
CROSS APPLY
(VALUES (-0.20),(-0.15),(-0.10),(-0.05),(0),(0.05),(0.10),(0.15),(0.20))x(guess)
GROUP BY
x.guess
This produces the following result.
Just like Google, XLeratorDB always returns the value used to create the test case.
Let's look at another example. Enter following information into another Excel worksheet.
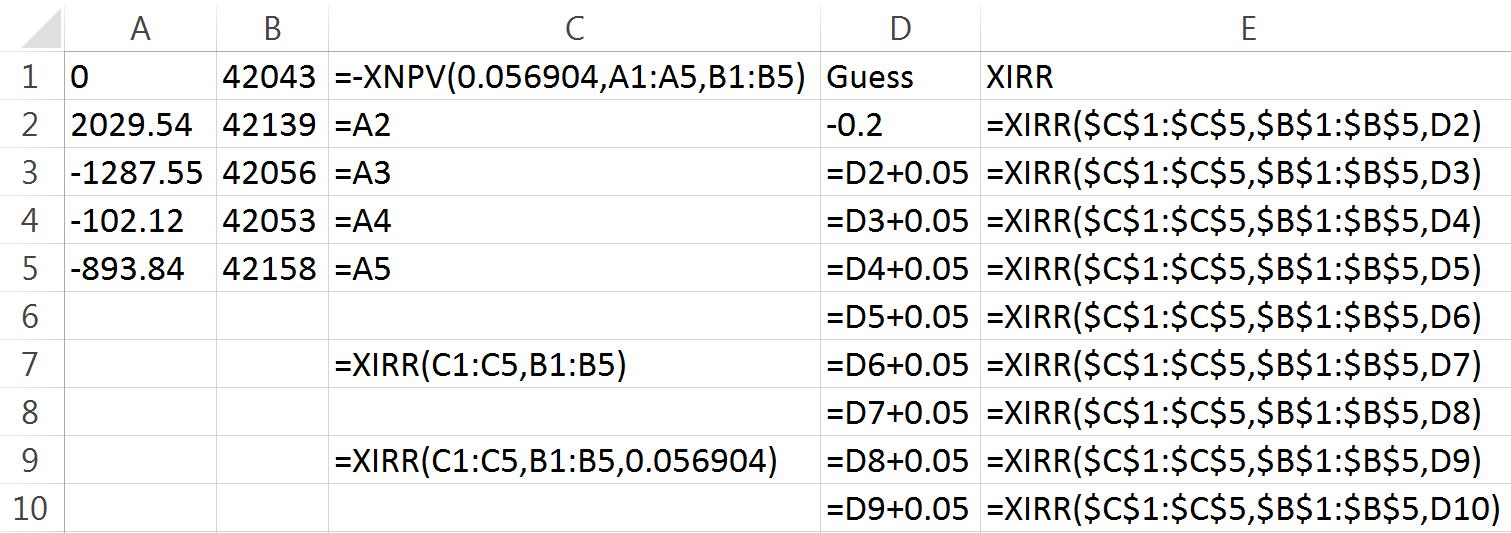
The worksheet should look like this.
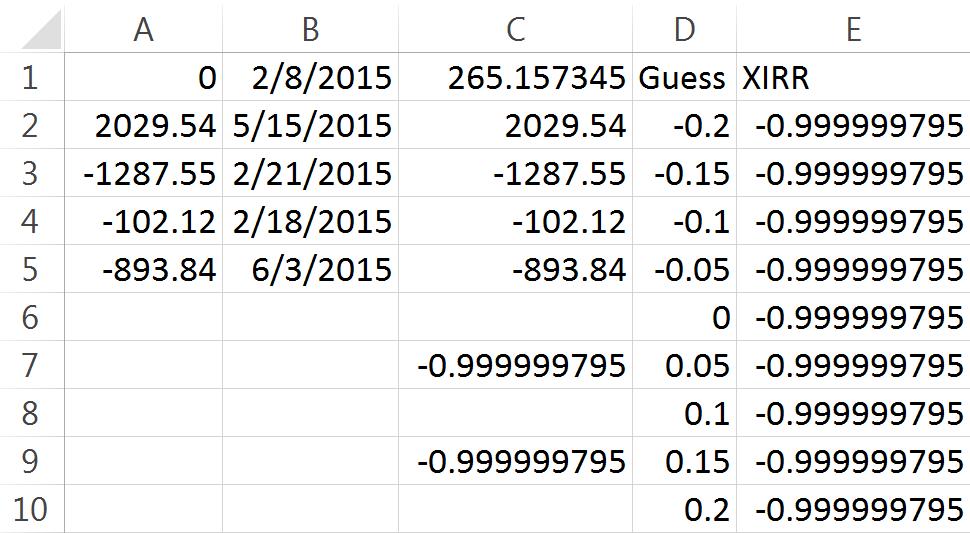
Just as with our first example, the Excel XIRR function is unable to recover the discount rate, 0.056904, used to create this test case. However, Google has no problem with it.
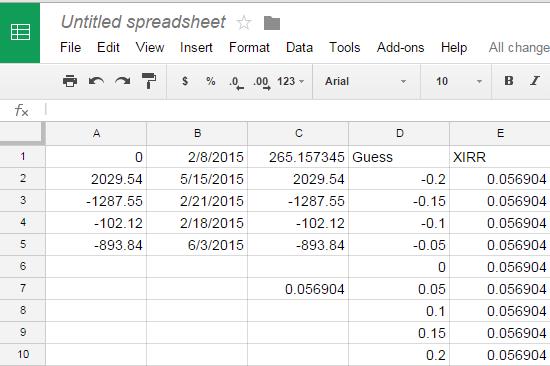
As before, Google always recovers the expected result as does XLeratorDB.
DECLARE @CF as TABLE (
amt_cf float,
date_cf datetime
)
INSERT INTO @CF VALUES (0,'2015-02-08')
INSERT INTO @CF VALUES (2029.54,'2015-05-15')
INSERT INTO @CF VALUES (-1287.55,'2015-02-21')
INSERT INTO @CF VALUES (-102.12,'2015-02-18')
INSERT INTO @CF VALUES (-893.84,'2015-06-03')
SELECT
x.guess,
ROUND(wct.XIRR(amt_cf,date_cf,x.guess),6) as XIRR
FROM (
SELECT
-wct.XNPV(.056904,amt_cf,date_cf) as amt_cf,
MIN(date_cf) as date_cf
FROM
@CF
UNION ALL
SELECT
amt_cf,
date_cf
FROM
@CF
)p
CROSS APPLY
(VALUES (-0.20),(-0.15),(-0.10),(-0.05),(0),(0.05),(0.10),(0.15),(0.20))x(guess)
GROUP BY
x.guess
This produces the following result.
Let's look at an example with a negative discount rate. Negative discount rates are a little trickier in Excel because for some unfathomable reason the Excel XNPV function does not support negative discount rates. This puts Excel users in the position of being unable to verify any negative values returned by the XIRR function with the XNPV function.
Because of this start by entering the following data into a Google sheet.
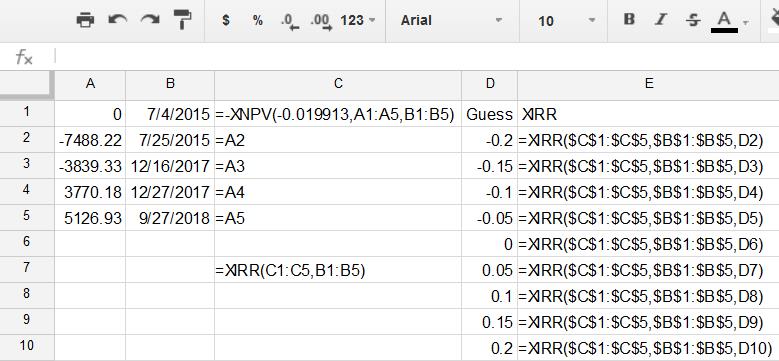
Which should end up looking like this.
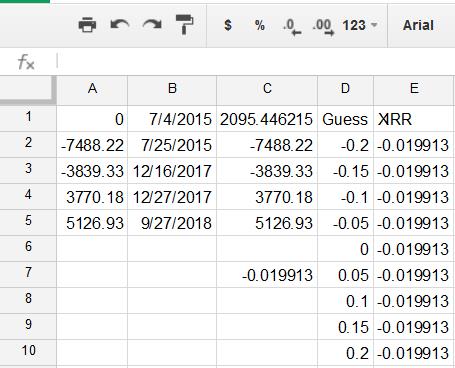
We then enter the same information into Excel.
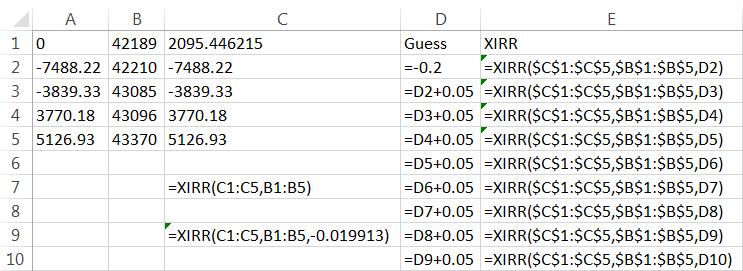
Which gives us a spreadsheet that looks like this.
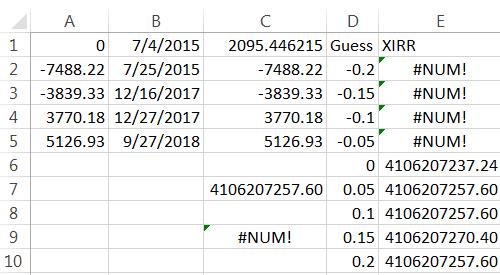
Again, Excel is completely unable to recover the -0.019913 that was used to create the cash flows initially, even when supplying that value in the guess parameter. And just like the Google sheet, XLeratorDB has no problem calculating the expected rate of return across a wide range of guesses.
DECLARE @CF as TABLE (
amt_cf float,
date_cf datetime
)
INSERT INTO @CF VALUES (0,'2015-07-04')
INSERT INTO @CF VALUES (-7488.22,'2015-07-25')
INSERT INTO @CF VALUES (-3839.33,'2017-12-16')
INSERT INTO @CF VALUES (3770.18,'2017-12-27')
INSERT INTO @CF VALUES (5126.93,'2018-09-27')
SELECT
x.guess,
ROUND(wct.XIRR(amt_cf,date_cf,x.guess),6) as XIRR
FROM (
SELECT
-wct.XNPV(-0.019913,amt_cf,date_cf) as amt_cf,
MIN(date_cf) as date_cf
FROM
@CF
UNION ALL
SELECT
amt_cf,
date_cf
FROM
@CF
)p
CROSS APPLY
(VALUES (-0.20),(-0.15),(-0.10),(-0.05),(0),(0.05),(0.10),(0.15),(0.20))x(guess)
GROUP BY
x.guess
This produces the following result.
If you are surprised by the behavior of the Excel XIRR function, perhaps it is time to stop using Excel for critical calculations like this and move up to XLeratorDB and SQL Server and find out what in-database analytics can do for you.
XLeratorDB works with SQL Server 2005 and above and contains over 750 really useful functions for finance, math, statistics, and engineering. With XLeratorDB and a basic knowledge of SQL you can transform your database into an analytic engine.