Powerful new aggregate functions in XLeratorDB/finance 2008
Feb
13
Written by:
Charles Flock
2/13/2011 3:41 PM

With the release of XLeratorDB/finance2008, the XLeratorDB/financial package makes innovative use of the multi-aggregate input capabilities of SQL Server 2008, improving performance in some calculations over 50-fold. In addition, there are some new functions that EXCEL wishes it had.
When we originally released XLeratorDB/financial, SQL Server 2005 was our target platform, as SQL Server 2008 still hadn’t been released. This forced us to make some compromises in our vision of the product, where we had to squeeze functions that looked like aggregates, at least on paper, into scalar functions. And some of these functions, like XIRR, IRR, XNPV, and NPV are our most popular functions.
With the release of SQL Server 2008, multi-input aggregates were finally supported. It is now technically possible to pass more than one column of data into the aggregate function. In September 2010 we released XLeratorDB/statistics2008, which was our first implementation of multi-input aggregates. As we expected, this gave our users huge performance boosts, as well as simplifying the SQL, and making the syntax almost identical to EXCEL. Now we have done the same thing for the financial functions.
The first difference is that you will find these functions in a different place in Management Studio
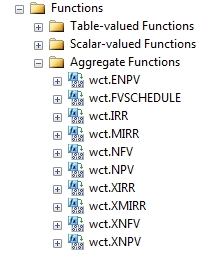
We have created multi-input aggregates for XIRR, IRR, MIRR, NPV, and XNPV, which previously had been scalar functions. This means that the syntax for these functions is different in XLeratorDB/finance2008 than it is in XLeratorDB/finance. Now, for example, if you wanted to calculate the internal rate of return for customer accounts, the SQL would look something like this:

This returns a result that looks like this.
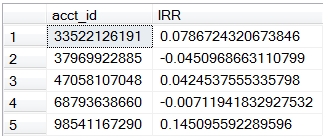
As you can see, this looks just like the EXCEL function with the same name. If you know how to use the function in EXCEL, using it in SQL Server 2008 should be simple and intuitive. In fact, it should be a lot easier than doing it in EXCEL, as there is no easy way in EXCEL to group the cash flows together for both calculation and reporting purposes.
It will also be a lot faster than doing it in EXCEL, or almost any other platform outside of the database. In our tests, using simple 32-bit and 64-bit desktop machines, we consistently average more than 100,000 rows per second. Results will vary based on the number of cash flows and the number of groups as well as on the machine configuration.
The XIRR and IRR functions have both been benchmarked against XLeratorDB/financial and EXCEL. In fact, our test harness includes 10,000 cases where EXCEL is unable to resolve to a solution but XLeratorDB is able to. You can find plenty of articles on our web site about the odd results that might be produced by the EXCEL XIRR calculation prior to EXCEL 2010.
Both XIRR and IRR are functions that iterate to a solution. If there are more than 2 cash flows involved, there is no closed-form solution, so iteration is only the method available.
MIRR, XNPV, and NPV, however, are what we call single-pass solutions. Which means that they perform their calculations on the set as the data are streamed to the aggregate; there is no looping and the calculations are not sensitive to the order of the data (unlike in EXCEL where the order will change the result in NPV and MIRR, and return #NUM! in XNPV if the cash flows are not in ascending date order). Thus, the functions are much faster than their equivalent scalar implementations. In XNPV, for example, on our simple desktop machines, we average over 500,000 rows per second, which is 50 times faster than the previous scalar implementation.
We also implemented 3 new aggregate functions, all of which are single-pass solutions: XMIRR, XNFV, and NFV. The XMIRR function is designed to do the same thing as the MIRR (Modified Internal Rate of Return) function, but instead of using periods, it uses dates. So, XMIRR is to MIRR in the way that XIRR is to IRR. The XMIRR function permits both positive and negative cash flows for the same date. The rate returned by the function is the annual rate.

This returns a result that looks like this.

The NFV (Net Future Value) and XNFV (Net Future Value for a schedule of cash flows that is not necessarily periodic) functions are analogous to the NPV (Net Present Value) and XNPV (Net Present Value for a schedule of cash flows that is not necessarily periodic) functions, the difference being that the new functions calculate the value as of the last date or period in the dataset passed to the function and the existing functions calculate the value back to the first date or period in the dataset. In other words, the NPV and XNPV functions discount to the beginning of the dataset whereas NFV and XNFV compound to the end of the dataset. Since they are single-pass solutions, they are insensitive to order.
There is no way to order data as it is streamed into an aggregate function in SQL Server, so any calculation the requires ordered data will always require a sort, which, in data processing terms, is expensive. We have gone to great pains to make these functions single-pass wherever possible. To make NPV, NFV, MIRR single pass and preserve order, we had to diverge from the EXCEL.
For illustration purposes, let’s look at the following EXCEL calculation:
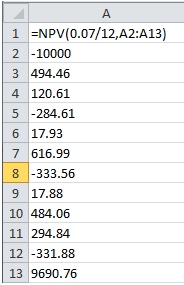
EXCEL will calculate the NPV (which is approximately 160.94) by discounting the cash flows based on their position in the column. Thus -10000 is in period 1, 9690.76 is in period 12. In the scalar implementation of the NPV function (which is still available in function NPV_q), we have a very similar syntax.
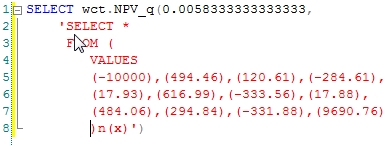
And this returns the same result as EXCEL.
However, to implement NPV as an aggregate, we needed to preserve the order of the cash flows, which requires that we pass an additional parameter to function, which we simply called period. If we were calculating the NPV from a table of cash flows, the SQL would look something like this:

A couple of interesting things happen by using an identifier for the period. First, you can have many cash flows for the same period and you do not need to summarize the cash flows before invoking function (something that you cannot do with the EXCEL function). Second, because the function is concerned about the spacing between the periods, rather than the actual period number, periods in which there are no cash flows can be omitted entirely. In EXCEL, those periods need to be included with a zero amount; otherwise the calculation will have the wrong number of periods. We think that having the periods passed into the function makes the function easier to use, especially in the SQL Server environment.
Since NPV, NFV, IRR, and MIRR are only concerned with the spacing of the periods (basically, the difference between the period being discounted and the first period or the last period), the actual period numbers themselves are not important. Whether you start with 1, 0, 100, or -1, it doesn’t really matter to the function.
Here’s a little example. I have created a simple table called CF. I have numbered the cash flows sequentially within a project, such that the first cash flow in Project 2 has a period that is one greater than the last cash flow in Project 1. I used that scheme for 5 projects in this test. Here’s a script to insert the data into the table.
INSERT INTO CF VALUES ('Project 1',1,-10000)
INSERT INTO CF VALUES ('Project 1',2,202.9)
INSERT INTO CF VALUES ('Project 1',3,68.57)
INSERT INTO CF VALUES ('Project 1',4,-229.53)
INSERT INTO CF VALUES ('Project 1',5,-51.17)
INSERT INTO CF VALUES ('Project 1',6,-465.89)
INSERT INTO CF VALUES ('Project 1',7,237.28)
INSERT INTO CF VALUES ('Project 1',8,35.39)
INSERT INTO CF VALUES ('Project 1',9,394.96)
INSERT INTO CF VALUES ('Project 1',10,124.91)
INSERT INTO CF VALUES ('Project 1',11,-35.5)
INSERT INTO CF VALUES ('Project 1',12,-65.71)
INSERT INTO CF VALUES ('Project 1',13,10327.09)
INSERT INTO CF VALUES ('Project 2',14,-10000)
INSERT INTO CF VALUES ('Project 2',15,-24.51)
INSERT INTO CF VALUES ('Project 2',16,-93.3)
INSERT INTO CF VALUES ('Project 2',17,-329.33)
INSERT INTO CF VALUES ('Project 2',18,60.75)
INSERT INTO CF VALUES ('Project 2',19,-83.81)
INSERT INTO CF VALUES ('Project 2',20,-151.26)
INSERT INTO CF VALUES ('Project 2',21,334.09)
INSERT INTO CF VALUES ('Project 2',22,-234.57)
INSERT INTO CF VALUES ('Project 2',23,439.94)
INSERT INTO CF VALUES ('Project 2',24,189.97)
INSERT INTO CF VALUES ('Project 2',25,-145.29)
INSERT INTO CF VALUES ('Project 2',26,9994.13)
INSERT INTO CF VALUES ('Project 3',27,-10000)
INSERT INTO CF VALUES ('Project 3',28,369.49)
INSERT INTO CF VALUES ('Project 3',29,217.23)
INSERT INTO CF VALUES ('Project 3',30,142.78)
INSERT INTO CF VALUES ('Project 3',31,-22.75)
INSERT INTO CF VALUES ('Project 3',32,198.5)
INSERT INTO CF VALUES ('Project 3',33,182.16)
INSERT INTO CF VALUES ('Project 3',34,332.53)
INSERT INTO CF VALUES ('Project 3',35,51.84)
INSERT INTO CF VALUES ('Project 3',36,-427.58)
INSERT INTO CF VALUES ('Project 3',37,-130.46)
INSERT INTO CF VALUES ('Project 3',38,-164.44)
INSERT INTO CF VALUES ('Project 3',39,9871.1)
INSERT INTO CF VALUES ('Project 4',40,-10000)
INSERT INTO CF VALUES ('Project 4',41,-177.07)
INSERT INTO CF VALUES ('Project 4',42,-116.11)
INSERT INTO CF VALUES ('Project 4',43,-258.89)
INSERT INTO CF VALUES ('Project 4',44,194.98)
INSERT INTO CF VALUES ('Project 4',45,-17.44)
INSERT INTO CF VALUES ('Project 4',46,-161.15)
INSERT INTO CF VALUES ('Project 4',47,-186.39)
INSERT INTO CF VALUES ('Project 4',48,-52.23)
INSERT INTO CF VALUES ('Project 4',49,117.67)
INSERT INTO CF VALUES ('Project 4',50,-271.51)
INSERT INTO CF VALUES ('Project 4',51,-85.6)
INSERT INTO CF VALUES ('Project 4',52,10146.99)
INSERT INTO CF VALUES ('Project 5',53,-10000)
INSERT INTO CF VALUES ('Project 5',54,-98.93)
INSERT INTO CF VALUES ('Project 5',55,219.15)
INSERT INTO CF VALUES ('Project 5',56,-257.52)
INSERT INTO CF VALUES ('Project 5',57,-15.92)
INSERT INTO CF VALUES ('Project 5',58,121.2)
INSERT INTO CF VALUES ('Project 5',59,7.28)
INSERT INTO CF VALUES ('Project 5',60,-599.73)
INSERT INTO CF VALUES ('Project 5',61,296.23)
INSERT INTO CF VALUES ('Project 5',62,192.59)
INSERT INTO CF VALUES ('Project 5',63,146.11)
INSERT INTO CF VALUES ('Project 5',64,467.65)
INSERT INTO CF VALUES ('Project 5',65,10030.69)
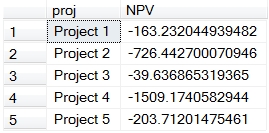
We can then run our SQL to calculate the net present value grouped by project.

This produces the following result.
We think that the new aggregate functions offer a big improvement in performance and ease of use. SQL Server 2008 is a requirement, however, so SQL Server 2005 users will have to continue to use the scalar implementations available in XLeratorDB/financial. Whether it’s SQL Server 2005 or 2008, having these functions available on the database makes much more sense than trying to ship the data off to EXCEL or trying to use Reporting Services. Let us know what you think.