Monte Carlo Simulation in SQL Server
Aug
24
Written by:
Charles Flock
8/24/2009 3:50 PM

A brief introduction to some techniques that will allow you to run Monte Carlo simulations in your SQL Server database using XLeratorDB functions.
I started out with the idea that I would write an article about using Monte Carlo simulation to analyze some baseball statistics. In the course of laying out what I wanted to do and discussing it with the people in the office, I realized that I had to take a step back and actually explain what a Monte Carlo simulation is, how it works, what its limitations are, and how to implement it in SQL Server.
The Monte Carlo simulation is a mechanism that evaluates the expected value of a random variable by generating repeated random sampling. In other words, the random variable is evaluated by guessing. Microsoft has a discussion on how to implement Monte Carlo simulations in EXCEL here. I actually found the EXCEL explanation a little hard to follow, so I will offer up my own explanation. And, since you can do it in EXCEL, I feel compelled to demonstrate that you can also do it in SQL Server. Whether or not you should do it in SQL Server will depend upon the nature of the simulation, the amount of CPU that you can dedicate to it, and how often it is going to be run.
The basis of a Monte Carlo simulation is that if you guess often enough and you use the right kind of guesses, you can come up with a pretty accurate evaluation of a random variable. This random variable could be a physical process, a business model, an investment portfolio, or any process that can be described in an equation.
In order for us to have confidence in the results produced by a Monte Carlo simulation the guesses must be generated randomly; meaning that there is no bias in the creation of the guess. There are massive amounts of documentation about the best ways to do this and how to evaluate the randomness of a random number generator. We are not going to get into that. We can just assume that the RAND() function satisfies the basic requirement for the generation of random numbers.
To demonstrate how to go about doing this, we are going to use Monte Carlo simulation to estimate the value for pi; there are plenty of examples of how to do this, but I have been unable to find any using T-SQL. Since we already know that pi is approximately equal to 3.14159, this will make it easy to see how the method works and what advantages and limitations the method has.
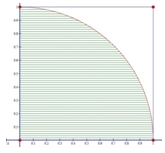 The diagram on the left shows a quarter-circle inscribed in a square. The lower-left hand corner of the square is at the origin of the grid, coordinates (0, 0). The other vertices are at (1, 0), (1, 1), and (0, 1). Thus, the area of the square is one and the radius of the circle is one. If we randomly generate numbers between zero and 1 and plot them on the grid, some of them will land inside the quarter-circle and some of them will land outside the quarter-circle.
Look at Figure 1 below. In it we have plotted the randomly generated x- and y-coordinates based on the number of trials. If the sum of the square of the coordinates is less than or equal to one (x2 + y2 ≤ 1), we have colored the plotted point red, otherwise the plotted point is light blue.
Figure 1
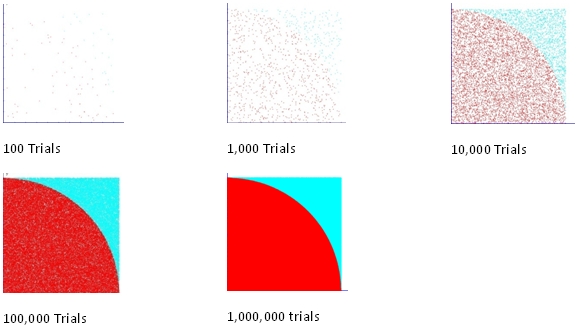
As you can see, when we run 100 trials, it is very hard to discern what the shape will look like. At 1,000 trials, if we squint, we can sort of make out a shape. At 10,000 trials, the shape of a quarter-circle is quite clear. At 100,000 trials we have a pretty sharp image of the quarter-circle. At a million trials, we have a very crisp image of a quarter-circle even though the plot was created from data points. I created the data points in a SQL select statement and then imported them into my graphing tool (aptly named Graph, which you can get here). So, if we think of our first rule of Monte Carlo simulation as no bias in the guessing, then the second rule is that the more guesses, the clearer the picture.
The estimation of pi becomes quite straightforward. We know the area of our square is one. We know this because all of our x- and y-coordinates are between zero and one[*]. Since we are plotting points on a grid, there is no real unit of measure, so the area of the square is one. The red area, the quarter-circle, is less than one, and the ratio of the circle to the square can be used to estimate pi simply by calculating the ratio of the number of points within the circle to the number of points in the trial. We then take that number and multiply it by 4.
If we were writing code to do this, we would simply generate the random numbers in a loop that looks something like this:
For i = 1 To n
X = Rnd()
Y = Rnd()
A = X ^ 2 + Y ^ 2
If A <= 1 Then
Inside = Inside + 1
End If
Next i
PI = Inside/n * 4
You can do this in SQL Server, but SQL Server is at its best when it operates on a set of data. Looping in SQL Server is very inefficient. The first thing that we need to do is generate a set containing the number of trials that we want to run. Here is a very simple way to do that.
/* Set up a variable for the number of iterations */
Declare @n as float
Set @n = 100
/* Generate numbers from 1 to @n */
Declare @numbers table(number int)
insert into @numbers(number)
select number from
( select row_number() over (order by s1.name) as number
from sysobjects s1 cross join sysobjects s2, sysobjects s3
) as numbers
where number between 1 and @n
All this does is insert sequential numbers into a table variable. The number of entries in the sysobjects table limits the range of numbers. Since we are using the CROSS JOIN to join the table to itself (twice) the range is equal to the number of objects in the sysobjects table cubed, which in our environment is usually good for up to 10 million sequential numbers. Remember, the only reason for doing this is to create a set of sequential numbers.
Next, we want to generate the random numbers. You might think that this is as easy as using the SQL Server RAND() function, but enter the following SELECT statement and look at the results:
/* randomly generate x and y coordinates for each each number */
select number as seq
,RAND() as x
,RAND() as y
from @numbers
You will get something that looks like this:
seq x y
----------- ---------------------- ----------------------
1 0.255111156465649 0.965846804684792
2 0.255111156465649 0.965846804684792
3 0.255111156465649 0.965846804684792
4 0.255111156465649 0.965846804684792
5 0.255111156465649 0.965846804684792
6 0.255111156465649 0.965846804684792
7 0.255111156465649 0.965846804684792
8 0.255111156465649 0.965846804684792
9 0.255111156465649 0.965846804684792
10 0.255111156465649 0.965846804684792
11 0.255111156465649 0.965846804684792
12 0.255111156465649 0.965846804684792
13 0.255111156465649 0.965846804684792
14 0.255111156465649 0.965846804684792
15 0.255111156465649 0.965846804684792
All the x and y coordinates are the same. Why is that? The optimizer evaluates RAND() only once per query which results in all generated values being the same. The books on-line documentation, in the remarks, says “Repetitive calls of RAND() with the same seed value return the same results.”
However, the XLeratorDB function wct.RAND() is evaluated for each row in the resultant table.
/* randomly generate x and y coordinates for each each number */
select number as seq
,wct.RAND() as x
,wct.RAND() as y
from @numbers
You will get something that looks like this:
seq x y
----------- ---------------------- ----------------------
1 0.516510053180502 0.300336813358371
2 0.955581176529064 0.669663333425865
3 0.652369827118227 0.536752110075932
4 0.982035856452412 0.158140299961149
5 0.78713668234332 0.624468424148781
6 0.0574093648979097 0.452295496349263
7 0.816855520388473 0.692823353946598
8 0.563061881790656 0.0810055484722718
9 0.1424403685785 0.838248377230464
10 0.69681706642108 0.135444610346081
11 0.422815357683475 0.927812256527774
12 0.206749397377299 0.493206329582589
13 0.838635603472415 0.424767082027519
14 0.737261481189132 0.5351205716478
15 0.744234733079599 0.435610332292252
Of course, since the numbers are generated randomly, if you run this SQL you will get different results. Now, we put together the whole SELECT statement and see what the Monte Carlo estimation of pi is:
/* Set up a variable for the number of iterations */
Declare @n as float
Set @n = 100
/* Generate numbers from 1 to @n */
Declare @numbers table(number int)
insert into @numbers(number)
select number from
( select row_number() over (order by s1.name) as number
from sysobjects s1 cross join sysobjects s2, sysobjects s3
) as numbers
where number between 1 and @n
/* randomly generate x and y coordinates for each each number */
; with mycte as
(select number as seq
,wct.RAND() as x
,wct.RAND() as y
from @numbers
)
/* calculate PI based on the randomly generated x and y coordinates */
select cast(4 as float) * cast(count(*) as float)/@N as PI
from mycte
where power(x,2)+ power(y, 2) <= 1
This produces the following result.
PI
----------------------
3.12
(1 row(s) affected)
This query may produce a different result every time that it executes, since we randomly generate the x- and y-coordinates.
If you refer back to Table 1, you can see that when we had 100 points it was very hard to discern the shape of the quarter-circle. So too here, it is hard to know if 3.12 is a reliable estimation of the value of pi.
When performing the Monte Carlo simulation, you need to make an estimate of the error in the simulation. The estimation of error gives us some idea of the reliability of the number and the likelihood that the value lays between an upper and a lower bound. This estimate is a measure of uncertainty in our result.
For Monte Carlo simulations, the processes are random, so each time it is run it will come up with slightly different results. The error in a random number of counts generated by a Monte Carlo simulation is approximately the square root of the number. Thus, in this case the uncertainty in our value of pi is equal to 4 times the square root of the number of points inside the circle divided by the number of points.
This shows one problem with a Monte Carlo method—to improve the accuracy of the results by a factor of 10 we need to run approximately 100 times more trials. Although this method of finding pi is very easy conceptually, it is not an efficient method for finding pi to a large number of digits. There are programs that have calculated pi to well over a billion digits, but not using a Monte Carlo approach since it would take far too much CPU time.
Let’s do a couple of things. First, if we are going to be running Monte Carlo simulations in T-SQL, then it makes sense to have a table of sequential numbers, rather than creating the numbers on the fly. Once we have created the table, this will give us a big boost in performance for future simulations. To do this, I created a table called Numbers:
CREATE TABLE [dbo].[Numbers](
[Num] [int] NOT NULL,
CONSTRAINT [PK_Numbers] PRIMARY KEY CLUSTERED
(
[Num] ASC
)
As you can see, it contains a single column, Num, which I have also made the primary key. I then inserted 10 million rows into the table with the following statement:
Insert into Numbers
select top 10000000 row_number() over (order by s1.name)
from sysobjects s1 cross join sysobjects s2, sysobjects s3
We can than incorporate that into our T-SQL script and include the estimation of the error and the number of trials:
/* Set up a variable for the number of iterations */
Declare @n as float
Set @n = 100
/* randomly generate x and y coordinates for each each number */
; with mycte as
(select wct.RAND() as x
,wct.RAND() as y
from Numbers
where num between 1 and @n
)
/* calculate PI based on the randomly generated x and y coordinates */
select @n [Trials]
,cast(4 as float) * cast(count(*) as float)/@N as [PI Approximate]
,cast(4 as float) * SQRT(cast(count(*) as float))/@N as [PI error]
from mycte
where power(x,2)+ power(y, 2) <= 1
Which produced this result:
Trials PI Approximate PI error
---------------------- ---------------------- ----------------------
100 3.36 0.366606055596467
I then took this script, and modified it to record the elapsed time and ran it for successively larger trials.
Trials PI Approximate PI error Elapsed time
---------------------- ---------------------- ---------------------- ----------------------
100 3.16 0.355527776692624 1.25
1000 3.18 0.112782977438973 1.306
10000 3.1664 0.0355887622712564 1.4
100000 3.1344 0.0111971424926184 2.873
1000000 3.142388 0.00354535639957396 15.773
As expected, as the number of trials increase, the accuracy of our estimate of pi improves. We can also quite clearly see the trade-off between accuracy and processing time.
Of course, we would never calculate pi this way, especially since there is a PI function in T-SQL. This merely served as a demonstration for some techniques that can be used to implement Monte Carlo simulation in SQL Server with XLeratorDB. Next time, we will take these techniques and use them with other XLeratorDB functions to come up with some estimates for common business problems and to analyze some baseball statistics.
[*] Technically the random number generator will not generate a 1 though it will get very close.