Dice Poker in SQL Server
Aug
21
Written by:
Charles Flock
8/21/2019 10:25 PM

Today we look at 2 different ways of calculating the probabilities for Dice Poker. The first approach requires knowledge of combinatorics which requires a fair amount of thinking and very little coding. The second approach, which is really a brute force approach just requires enough SQL that you know how to use the PIVOT and UNPIVOT commands.
Dice Poker is more or less what you think it is; you roll 5 dice and then have the option of re-rolling some or all of the dice to improve your hand. Apparently, there could be gambling involved and the person with the better hand wins the stakes for a given hand. I guess if you have enough dice, you could have more than 2 players. Dice Poker, I have been informed, is one aspect of the Witcher action role-paying game.
Here’s how to calculate the probabilities in Dice Poker, in order of pay-off. In other words, even though the probability of a High Straight and a Low Straight are the same the High Straight beats the Low Straight the probability of a bust or losing hand is much lower than getting one pair, the pair beats the bust.
- Five of a kind: there are 6 combinations one for each face on the dice.
- High Straight: all the possible arrangements of 23456.
- Low Straight: all possible arrangements of 12345.
- Four of a kind: 6 face for the 4 of a kind; 5 possible singletons; 5 possible positions for the singleton.
- Full House: 6 faces for the 3 of-a-kind; 5 left for the pair; 5c2 = 10 possible positions for the pair.
- Three of a kind: 6 faces for the 3 of a kind; 5c2 singletons; 5c3 positions for the 3 of a kind.
- Two pair: 6c2 ways to combine faces; 4 possible faces for the singleton; 5c2 positions for the first pair; 3c2 positions for the second pair.
- One Pair: 6 faces for the pair; 5!/2! possible combinations for the singletons, 5c2 arrangements for the pair
- Loser: The total permutations (65) minus all the preceding values; all the possible combinations of singletons (6!) minus the High Straight and Low Straight combinations
Using XLeratorDB, we can calculate to total number of permutations and the number of permutations for each category
SELECT
wct.COMBIN(6,1) as [5 of a kind],
wct.FACT(5) as [High Straight],
wct.FACT(5) as [Low Straight],
6e+00*5e+00*5e+00 as [4 of a kind],
6*5*wct.COMBIN(5,2) as [Full House],
6*wct.COMBIN(5,2)*wct.COMBIN(5,3)*2 as [Three of a kind],
wct.COMBIN(6,2)*4*wct.COMBIN(5,2)*wct.COMBIN(3,2) as [2 pair],
wct.FACTORIALPOWER(6,4,1)*wct.COMBIN(5,2) as [1 pair],
wct.FACT(6) - 2*wct.FACT(5) as [Loser],
wct.POWER(6,5) as Total
This produces the following result.
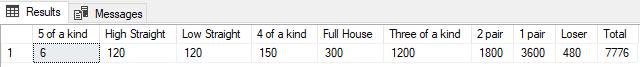
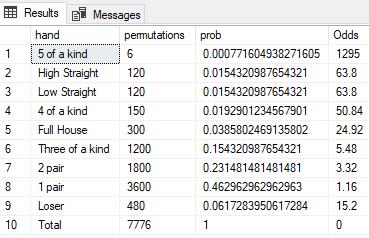
While this gives the proper counts for each hand and the total number of hands the columnar representation makes it unnecessarily complicated to calculate the probability and the odds. Using the UNPIVOT command, we can put this data into 3rd-normal form and then compute the probabilities with one statement for all permutations.
SELECT
u.hand
,u.permutations
,u.permutations / wct.POWER(6,5) as prob
,wct.POWER(6,5) / u.permutations - 1 as Odds
FROM (
SELECT
wct.COMBIN(6,1) as [5 of a kind],
wct.FACT(5) as [High Straight],
wct.FACT(5) as [Low Straight],
6e+00*5e+00*5e+00 as [4 of a kind],
6*5*wct.COMBIN(5,2) as [Full House],
6*wct.COMBIN(5,2)*wct.COMBIN(5,3)*2 as [Three of a kind],
wct.COMBIN(6,2)*4*wct.COMBIN(5,2)*wct.COMBIN(3,2) as [2 pair],
wct.FACTORIALPOWER(6,4,1)*wct.COMBIN(5,2) as [1 pair],
wct.FACT(6) - 2*wct.FACT(5) as [Loser],
wct.POWER(6,5) as Total
)d
UNPIVOT
(permutations for hand in (
[5 of a kind]
,[High Straight]
,[Low Straight]
,[4 of a kind]
,[Full House]
,[Three of a kind]
,[2 pair]
,[1 pair]
,[Loser]
,Total)
)u
This produces the following results.
That was a pretty easy, assuming that you know the math.
Here’s a completely different approach that doesn’t require any knowledge of combinatorics. We can start by generating all the possible combinations; we already know that it’s 65 permutations; not a lot of data.
SELECT
IDENTITY(int, 1,1) as id
,k1.SeriesValue as [1]
,k2.SeriesValue as [2]
,k3.SeriesValue as [3]
,k4.SeriesValue as [4]
,k5.SeriesValue as [5]
INTO
#tab1
FROM wct.SeriesInt(1,6,NULL,NULL,NULL)k1
CROSS APPLY wct.SeriesInt(1,6,NULL,NULL,NULL)k2
CROSS APPLY wct.SeriesInt(1,6,NULL,NULL,NULL)k3
CROSS APPLY wct.SeriesInt(1,6,NULL,NULL,NULL)k4
CROSS APPLY wct.SeriesInt(1,6,NULL,NULL,NULL)k5
Here are the first 10 rows from #tab1:
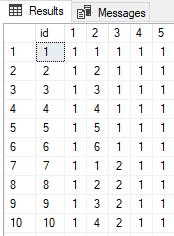
The id column uniquely identifies the ‘hand’, columns 1–5 represent the 5 die and each of the die columns contains a value from 1 to 6. All that’s left to do is categorize each hand and then count by category.
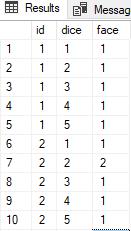
While this table structure is very easily interpreted by humans, categorizing and counting in SQL Server is much more easily done when tables are in 3rd-normal form. It’s pretty easy to do that to this table using UNPIVOT.
SELECT
id
,dice
,face
INTO
#tab2
FROM (SELECT id, [1], [2], [3], [4], [5] FROM #tab1) p
UNPIVOT (face FOR dice IN ([1], [2], [3], [4], [5])) unpvt
Here are the first 10 rows from #tab2.
My next step is counter-intuitive. I am going to count the face values for each id and then PIVOT the results, making face the column value, and CONCATENATE them. This will give us a six-character string containing the counts of each face in a given hand. For example, a hand of 5 threes would generate ‘005000’; a hand of 3 ones and 2 sixes would generate ‘300002’. We can simply look at the string pattern to categorize the hand, with one exception.
The High and Low Straight (as well as Loser) will only have ones in the count string. Thus, we need to know a bit more than just the counts to distinguish these three; we need to know something about the contents of the hand. We can get everything that we need by using the CONCATENATE function on the ‘dice’ columns from #tab1.
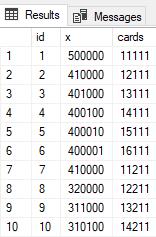
We can use this SQL to create the concatenated counts (x in this example) and hands.
SELECT
pvt.id
,CONCAT(pvt.[1], pvt.[2], pvt.[3], pvt.[4], pvt.[5], pvt.[6]) as x
,CONCAT(#tab1.[1], #tab1.[2], #tab1.[3], #tab1.[4], #tab1.[5]) as cards
FROM
#tab2
PIVOT (COUNT(dice) FOR face IN ([1], [2], [3], [4], [5], [6]))pvt
INNER JOIN
#tab1
ON
pvt.id = #tab1.id
This gives us a table that looks like this.
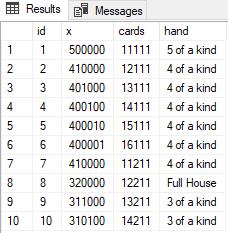
With this structure it’s very easy to construct a CASE statement to categorize each hand.
SELECT
n.id,
n.x,
n.cards,
CASE
WHEN x LIKE '%5%' THEN '5 of a kind'
WHEN x LIKE '%4%' THEN '4 of a kind'
WHEN x like '%3%' AND x LIKE '%2%' THEN 'Full House'
WHEN x like '%3%' THEN '3 of a kind'
WHEN wct.COUNTSTRING(x,'2',NULL) = 2 THEN '2 pair'
WHEN wct.COUNTSTRING(x,'2',NULL) = 1 THEN '1 pair'
ELSE
CASE
WHEN CHARINDEX('1',n.cards) = 0 AND CHARINDEX('6',n.cards) > 0 THEN 'High Straight'
WHEN CHARINDEX('1',n.cards) > 0 AND CHARINDEX('6',n.cards) = 0 THEN 'Low Straight'
ELSE 'Loser'
END
END as hand
FROM (
SELECT
pvt.id
,CONCAT(pvt.[1], pvt.[2], pvt.[3], pvt.[4], pvt.[5], pvt.[6]) as x
,CONCAT(#tab1.[1], #tab1.[2], #tab1.[3], #tab1.[4], #tab1.[5]) as cards
FROM
#tab2
PIVOT (COUNT(dice) FOR face IN ([1], [2], [3], [4], [5], [6]))pvt
INNER JOIN
#tab1
ON
pvt.id = #tab1.id
)n
This produces a table that looks like this.
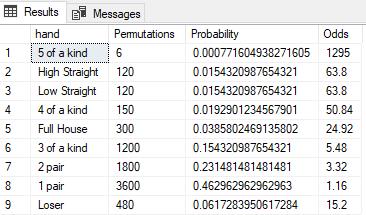
All that remains is to count the hands and calculate the probabilities and the odds.
SELECT
p.hand,
COUNT(*) as Permutations,
COUNT(*) / wct.POWER(6,5) as [Probability],
wct.POWER(6,5) / COUNT(*) - 1 as Odds
FROM (
SELECT
n.id,
n.x,
n.cards,
CASE
WHEN x LIKE '%5%' THEN '5 of a kind'
WHEN x LIKE '%4%' THEN '4 of a kind'
WHEN x like '%3%' AND x LIKE '%2%' THEN 'Full House'
WHEN x like '%3%' THEN '3 of a kind'
WHEN wct.COUNTSTRING(x,'2',NULL) = 2 THEN '2 pair'
WHEN wct.COUNTSTRING(x,'2',NULL) = 1 THEN '1 pair'
ELSE
CASE
WHEN CHARINDEX('1',n.cards) = 0 AND CHARINDEX('6',n.cards) > 0 THEN 'High Straight'
WHEN CHARINDEX('1',n.cards) > 0 AND CHARINDEX('6',n.cards) = 0 THEN 'Low Straight'
ELSE 'Loser'
END
END as hand
FROM (
SELECT
pvt.id
,CONCAT(pvt.[1], pvt.[2], pvt.[3], pvt.[4], pvt.[5], pvt.[6]) as x
,CONCAT(#tab1.[1], #tab1.[2], #tab1.[3], #tab1.[4], #tab1.[5]) as cards
FROM
#tab2
PIVOT (COUNT(dice) FOR face IN ([1], [2], [3], [4], [5], [6]))pvt
INNER JOIN
#tab1
ON
pvt.id = #tab1.id
)n
)p
GROUP BY
p.hand
This produces the following result.
It’s always cool to see the variety of analyses that can be done using XLeratorDB and SQL Server. You should download the 15-day trial today and start using it to analyze your data.
If there are other calculations you would like to see or you have questions about XLeratorDB, please send an email to support@westclintech.com